Simple Car Wide Presentation Map&Donut Chart – Market Share Analysis
RJ0200057_13
- Last Update 04/14/2025
- File Size 8.2MB
- # of Slides 2
- File Format PPTX
- Slide Ratio 16:9
- Color
Keywords
- #Content-Based Slides
- #Design-Based Slides
- #Market and Competitor Analysis
- #Graph
- #Other
- #Market Share
- #Market Analysis
- #Circles
- #Doughnut Chart
- #Map
- #16:9
- #world map PowerPoint slide
- #map template download
- #donut chart slide
- #market analysis PPT
- #location pin map
- #regional data visualization
- #how to create world map in PowerPoint
About the Product
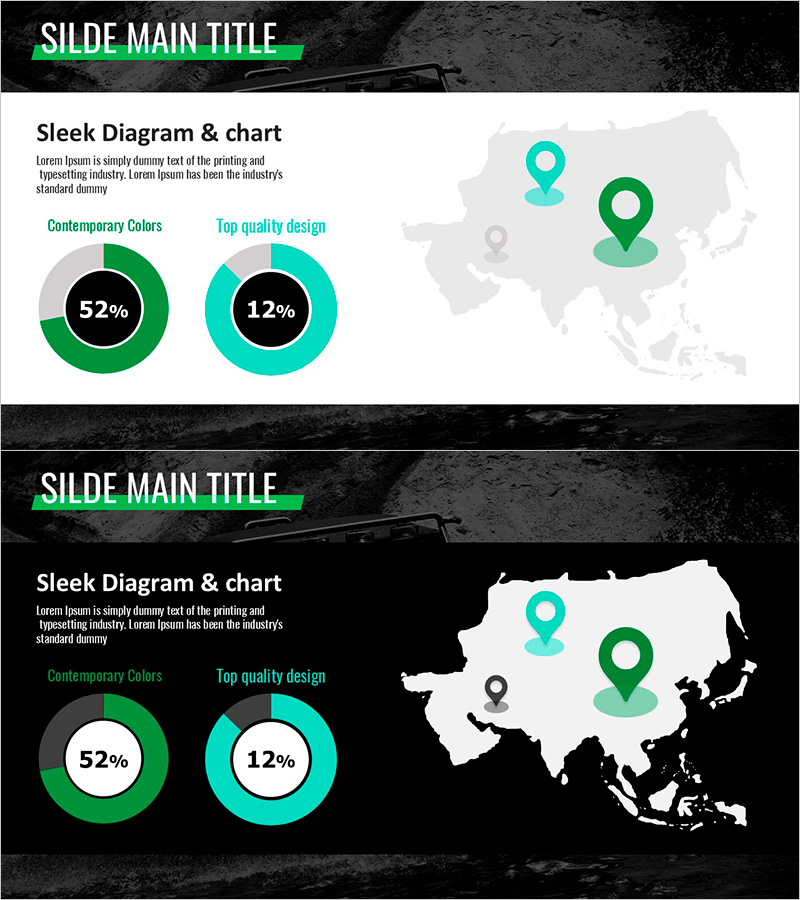
A 2-slide PowerPoint template designed for global market analysis and regional data visualization. The first slide features a light background with a world map and cyan and green location pin icons representing regional offices, branches, and distribution points. The second slide uses a dark background with the same map combined with two donut charts to emphasize market share, sales proportion, and customer distribution. The donut charts display 52% and 12% data in cyan, green, and gray segments, making this presentation template immediately applicable to business reports, marketing plans, and investor pitches.
Usage Points
-
Main Usage
Visualize global market status, regional office distribution, and sales market share at a glance. The location pins on the world map mark countries, regions, and offices while donut charts simultaneously convey numerical proportions, enhancing credibility in international business presentations.
-
How to Use
Use the first slide with light background during overview stage to introduce regional distribution. Deploy the second slide with dark background during data analysis phase to emphasize market share and sales proportion. Customize the location pins and donut chart colors to match your company brand palette.
-
Recommended For
Ideal for international business presentations, overseas sales reports, global marketing plans, investor briefings, and regional sales analysis. Recommended for executives, marketing teams, sales departments, and management preparing materials for multinational corporations, import-export companies, and global service enterprises.
-
Slide Structure
Slide 1: Light background + world map (gray) + 3 location pins (2 cyan, 1 green, 1 gray) / Slide 2: Dark background + world map (white) + 3 location pins + 2 donut charts (52% and 12% data, 3-color scheme: cyan, green, gray) / 16:9 widescreen ratio / PPTX format
Related Products
-

World Map and Share Chart for Market Analysis – Effective Data Visualization
#Market and Competitor Analysis #Graph #Other
-

Donut Chart & Map Template for Social Network Visualization
#Market and Competitor Analysis #Graph #Other
-

Market Share Analysis vs Competitors – Data Visualization
#Market and Competitor Analysis #Graph #Market Share
-

Donut Chart Visualizing Recycling Survey Data
#Market and Competitor Analysis #Graph #Market Share
