Donut Chart & Map Template for Social Network Visualization
RJ0200055_7
- Last Update 04/14/2025
- File Size 0.8MB
- # of Slides 2
- File Format PPTX
- Slide Ratio 16:9
- Color
Keywords
About the Product
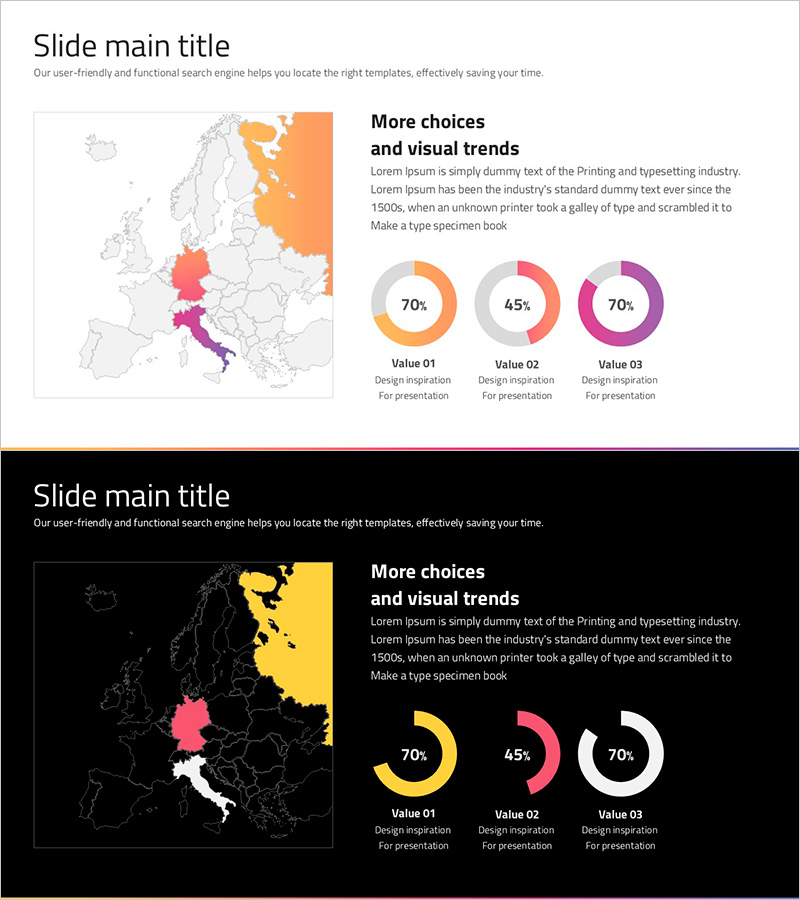
A 2-slide PowerPoint presentation combining a European map with donut charts for regional data visualization. Features three color-coded regions (orange, pink, purple) on the left map and corresponding donut charts on the right showing percentage data. Optimized for 16:9 widescreen format in PPTX, ready for market analysis, social network analysis, regional performance reports, and geographic data presentations. Clear text areas and data input fields enable quick customization without design skills.
Usage Points
-
Main Usage
Simultaneously display regional and country-level data through map and donut chart visualization, conveying geographic distribution and percentage information at a glance. Ideal for presenting market share, social network analysis, regional sales, customer distribution, and other spatially-referenced data.
-
How to Use
Slide 1 shows the European map with 3 highlighted regions in distinct colors. Slide 2 displays 3 corresponding donut charts showing percentage breakdowns. Double-click text boxes and data fields to replace with your own information. No design experience required.
-
Recommended For
Marketing professionals, sales leaders, executives, consultants, and academic presenters explaining regional performance, market conditions, and customer distribution. Particularly effective for international business, regional marketing, and social media analytics presentations.
-
Slide Structure
Slide 1: European map (gray background) with 3 highlighted regions (orange, pink, purple) / Slide 2: 3 donut charts (sample data 70%, 45%, 70%) with legend text areas. Total 2 slides, 16:9 aspect ratio, PPTX format.
Related Products
-

Simple Car Wide Presentation Map&Donut Chart – Market Share Analysis
#Market and Competitor Analysis #Graph #Other
-

World Map and Share Chart for Market Analysis – Effective Data Visualization
#Market and Competitor Analysis #Graph #Other
-

Visualizing South Korea's Market Share – Data-Driven Insights
#Company Introduction #Market and Competitor Analysis #Graph
-

Market Share Global Map – Real-Time Data for Market Analysis
#Market and Competitor Analysis #Graph #Market Share
