Donut Chart Visualizing Recycling Survey Data
RJ0600105_13
- Last Update 07/19/2025
- File Size 7.2MB
- # of Slides 2
- File Format PPTX
- Slide Ratio 16:9
- Color
Keywords
About the Product
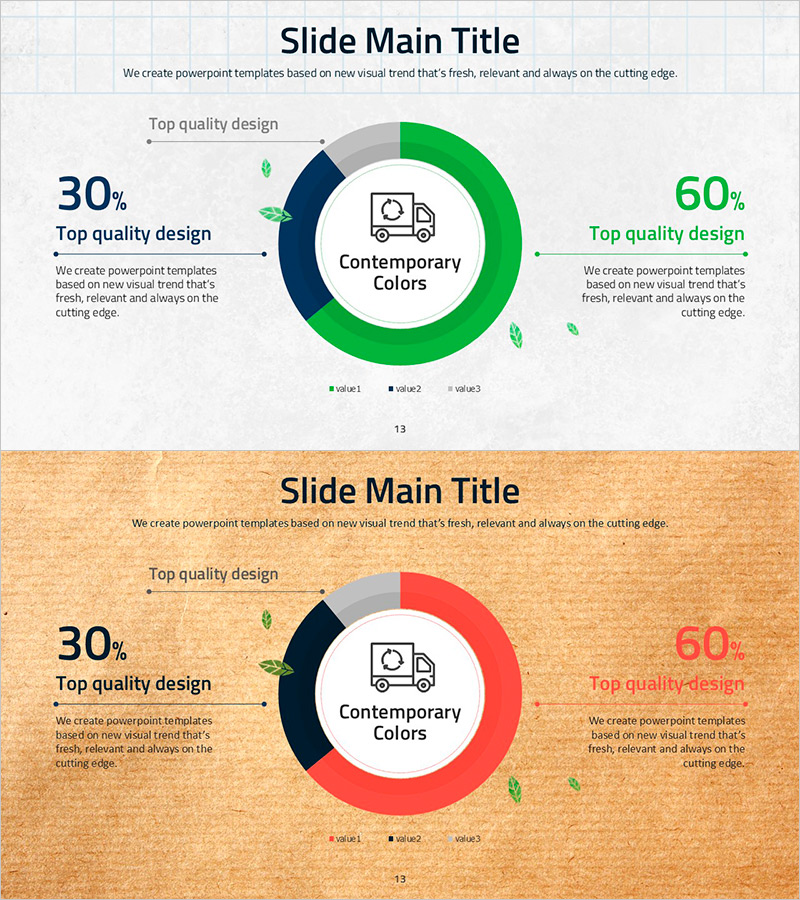
A PowerPoint slide featuring a 3-segment donut chart that visualizes recycling survey data with clear color differentiation in green, navy blue, and gray tones. The layout uses a symmetric design with a central icon and text label, flanked by percentage values and descriptive text on both sides. This slide template is ready for immediate use in presenting ratio-based data analysis such as market share, customer satisfaction, or resource allocation in business reports and presentations.
Usage Points
-
Main Usage
Optimized for visualizing survey results, market analysis, and customer research data in ratio-based format. The donut chart's center space allows emphasis on key topics or icons, while clearly comparing the composition of three data segments.
-
How to Use
Use in marketing plans, business reports, and market analysis presentations to explain customer preferences, resource distribution, or market share. Simply update the item names, descriptions, and percentage values in the left and right text areas for immediate deployment.
-
Recommended For
Ideal for marketing professionals, business analysts, data scientists, and executives presenting quantitative research findings to stakeholders. Particularly suited for sustainability, environmental, and recycling-related project presentations.
-
Slide Structure
2-slide set in 16:9 widescreen format. First slide features a green, navy, and gray donut chart with central icon. Second slide presents the same structure on an orange background, providing color variation options for different presentation contexts.
Related Products
-

Donut Chart Slide for Furniture Preferences Survey
#Market and Competitor Analysis #Graph #Market Share
-

Donut Chart Slide for Dessert Menu Research – Market Analysis
#Market and Competitor Analysis #Diagram #Graph
-

World Map and Share Chart for Market Analysis – Effective Data Visualization
#Market and Competitor Analysis #Graph #Other
-

Analysis of Crime Occurrence Locations – Data Visualization
#Market and Competitor Analysis #Graph #Market Share
