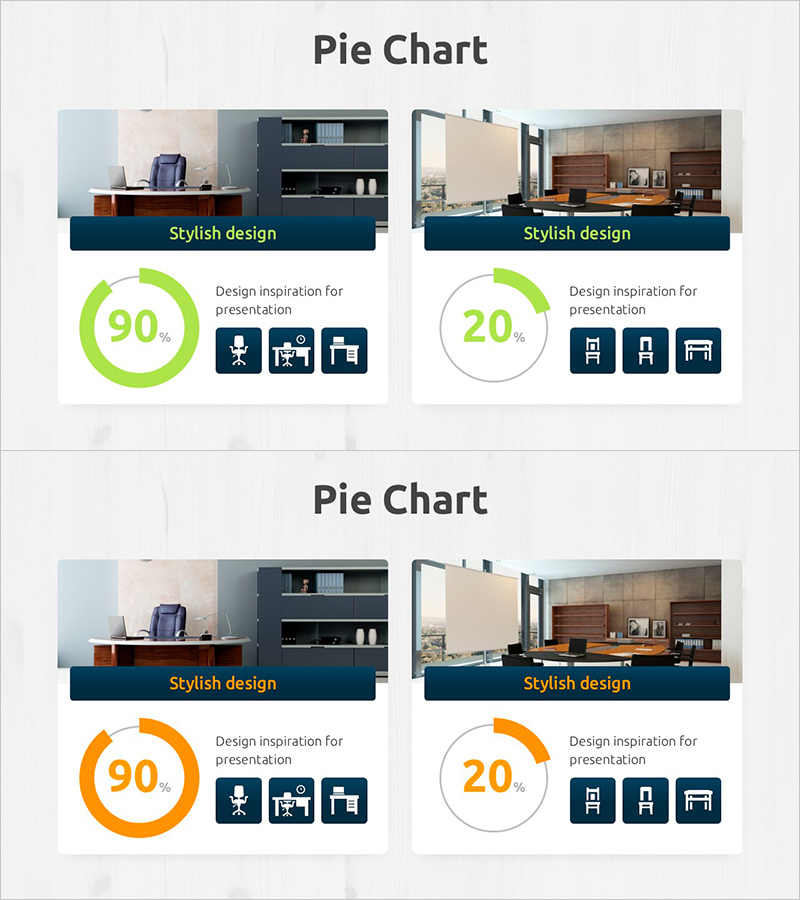
Donut Chart Visualizing Merchandise Sales Proportion
RJ0900029_12
- Last Update 08/24/2025
- File Size 1.3MB
- # of Slides 2
- File Format PPTX
- Slide Ratio 16:9
- Color
Keywords
About the Product
A professional donut chart PowerPoint slide designed to visualize product sales proportions and market share distribution. Available in two color versions—lime green and orange—each optimized for business presentations and market analysis. The 16:9 widescreen format includes 2 fully editable slides featuring percentage values and icons for enhanced data clarity. Perfect for displaying sales performance, customer composition, market analysis, and comparative ratio data in executive presentations and strategic planning sessions.
Usage Points
-
Main Usage
Clearly represents product sales ratios, market share distribution, and customer composition as part-to-whole relationships. The centered percentage value and surrounding icons enable instant data comprehension, making it ideal for executive presentations, quarterly business reviews, and strategic market analysis.
-
How to Use
Select the donut chart area and input your data values; the proportions update automatically. Choose between the lime green or orange color version to match your presentation theme and corporate branding. Customize the percentage values and icons as needed for your specific data.
-
Recommended For
Sales and marketing team performance reports, executive quarterly earnings presentations, investor pitch decks, product portfolio composition explanations, and market segment analysis. Particularly effective for displaying product revenue breakdown, customer segmentation, and competitive market positioning.
-
Slide Structure
2-slide layout with each slide featuring a centered donut chart displaying percentage values, accompanied by 3 icons on the right side. First slide uses lime green color scheme; second slide features orange tones. Both optimized for 16:9 widescreen format with full editing capability.
Related Products
-

World Map and Share Chart for Market Analysis – Effective Data Visualization
#Market and Competitor Analysis #Graph #Other
-

Doughnut Chart Slide Visualizing Market Share by Country
#Market and Competitor Analysis #Graph #Other
-

Work Progress Analysis Graph – Market Share Visualization
#Market and Competitor Analysis #Graph #Market Share
-

Competition and Cooperation Donut Charts
#Market and Competitor Analysis #Graph #Market Share
