World Map and Share Chart for Market Analysis – Effective Data Visualization
RJ0600007_17
- Last Update 06/22/2025
- File Size 2.3MB
- # of Slides 2
- File Format PPTX
- Slide Ratio 16:9
- Color
Keywords
About the Product
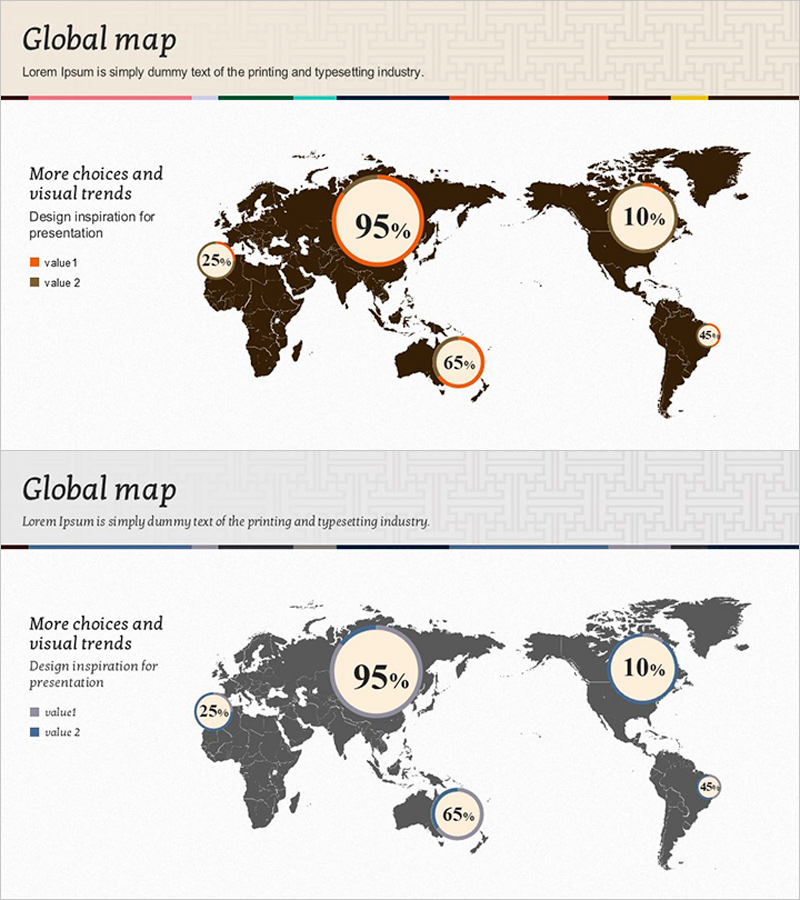
A 2-slide PowerPoint template combining world map visualization with pie charts for regional data analysis. The brown-toned map displays four circular charts in orange and beige showing market share percentages (95%, 65%, 25%, 10%) across different regions. Perfect for global sales reports, market analysis presentations, regional performance comparisons, and international business strategy meetings. Fully editable in 16:9 widescreen PPTX format compatible with all PowerPoint versions. Customize colors, percentages, and labels to match your specific data and branding requirements.
Usage Points
-
Main Usage
Visualize global market distribution, regional sales performance, country-level market share, and geographic data analysis. The combination of world map and pie charts enables simultaneous presentation of numerical data and spatial information for enhanced audience comprehension.
-
How to Use
Apply in quarterly business reports, investor presentations, marketing strategy meetings, and international performance reviews. Simply replace the pie chart values and region labels with your actual data to create a professional geographic analysis slide in minutes.
-
Recommended For
Sales managers, marketing directors, business executives, management consultants, and international business professionals presenting global performance metrics. Ideal for multinational corporations, export-import companies, and global service providers in strategy sessions and external stakeholder presentations.
-
Slide Structure
Slide 1: Brown-toned world map background with four pie charts positioned on respective regions (95%, 65%, 25%, 10% values displayed). Slide 2: Identical layout in dark gray tone. Both slides include title area, descriptive text space, and legend section with consistent color scheme throughout.
Related Products
-

Simple Car Wide Presentation Map&Donut Chart – Market Share Analysis
#Market and Competitor Analysis #Graph #Other
-

Donut Chart & Map Template for Social Network Visualization
#Market and Competitor Analysis #Graph #Other
-

Sea Lighthouse Market Share Donut Chart
#Market and Competitor Analysis #Graph #Market Share
-

Doughnut Chart Slide Visualizing Market Share by Country
#Market and Competitor Analysis #Graph #Other
