Circular Gradient Wide Template Donut Chart – Business Introduction and Revenue Model
RJ0200056_9
- Last Update 04/14/2025
- File Size 2.6MB
- # of Slides 2
- File Format PPTX
- Slide Ratio 16:9
- Color
Keywords
About the Product
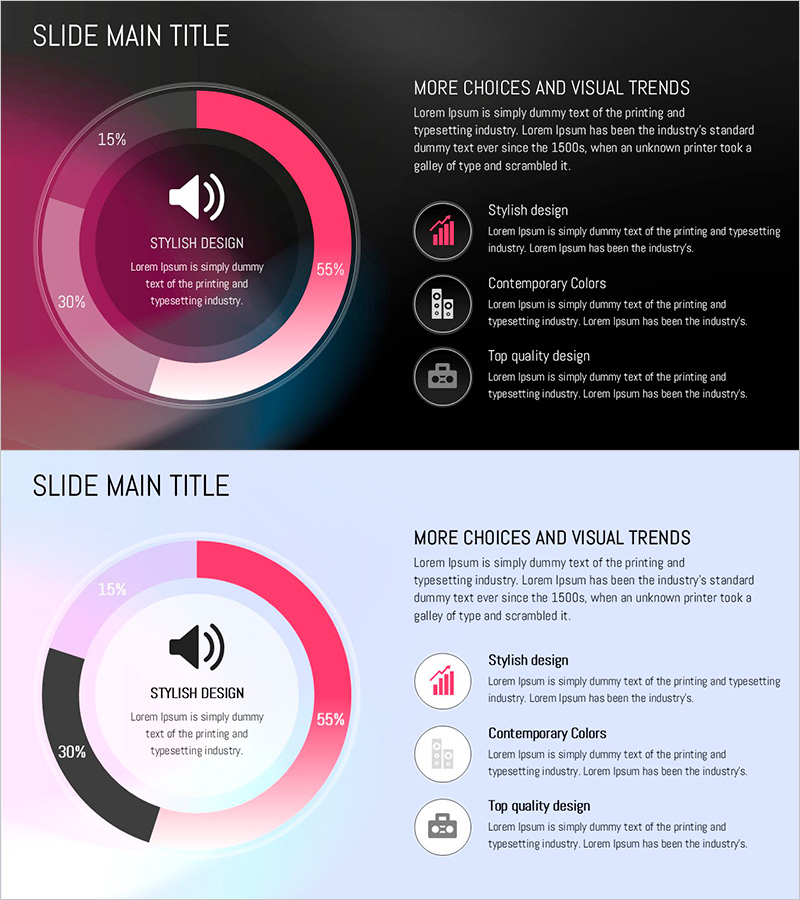
A donut chart PowerPoint slide designed to visualize business introduction and revenue model with three proportional segments. The slide features a pink, purple, and blue gradient background with a central icon and text that emphasize the core message. The 2-slide set is ideal for comparing various data scenarios and can be used in presentations, business plans, and reports to convey composition ratios, market share, and revenue distribution intuitively. Available in 16:9 widescreen PPTX format for immediate editing.
Usage Points
-
Main Usage
Optimized for comparing 3-4 items' relative proportions in circular format, such as business structure, revenue distribution, market share, and composition ratios. The central icon area highlights the main topic, while each segment displays numerical values and labels for enhanced data readability.
-
How to Use
Use in the business introduction, technology status, or revenue model sections of presentations to visualize component proportions. Edit the text and values in each segment to input actual data, and customize colors and icons as needed to match your brand identity.
-
Recommended For
Recommended for business planners, marketing managers, financial analysts, and executive reporting. Ideal for investment pitch decks, business plans, quarterly performance reports, and product introduction presentations where clear communication of key metric composition is essential.
-
Slide Structure
2-slide set with each slide featuring a central icon surrounded by a 3-segment donut chart. The left chart displays 15%, 30%, and 55% proportions, while the right side arranges three item descriptions with corresponding icons, presenting both data and interpretation simultaneously.
Related Products
-

Financial Management Analysis Status Graph
#Product/Service Introduction #Business Introduction #Graph
-

Investment Profit Structure Donut Chart
#Product/Service Introduction #Business Introduction #Diagram
-

Manufacturing Donut Circle Chart – Visual Data Representation
#Product/Service Introduction #Business Introduction #Graph
-

Automotive Technology Revenue Model Analysis Chart – Modern and Sleek Design
#Product/Service Introduction #Business Introduction #Diagram
