Idea Development Status Graph – Stylish Donut Chart for Market Analysis
RJ0300063_23
- Last Update 05/05/2025
- File Size 4.4MB
- # of Slides 2
- File Format PPTX
- Slide Ratio 16:9
- Color
Keywords
- #Content-Based Slides
- #Design-Based Slides
- #Business Introduction
- #Market and Competitor Analysis
- #Graph
- #Technological Status
- #Market Share
- #Circles
- #Doughnut Chart
- #16:9
- #donut chart PowerPoint
- #pie chart slide template
- #ratio analysis presentation
- #4-segment data visualization
- #donut graph slide download
About the Product
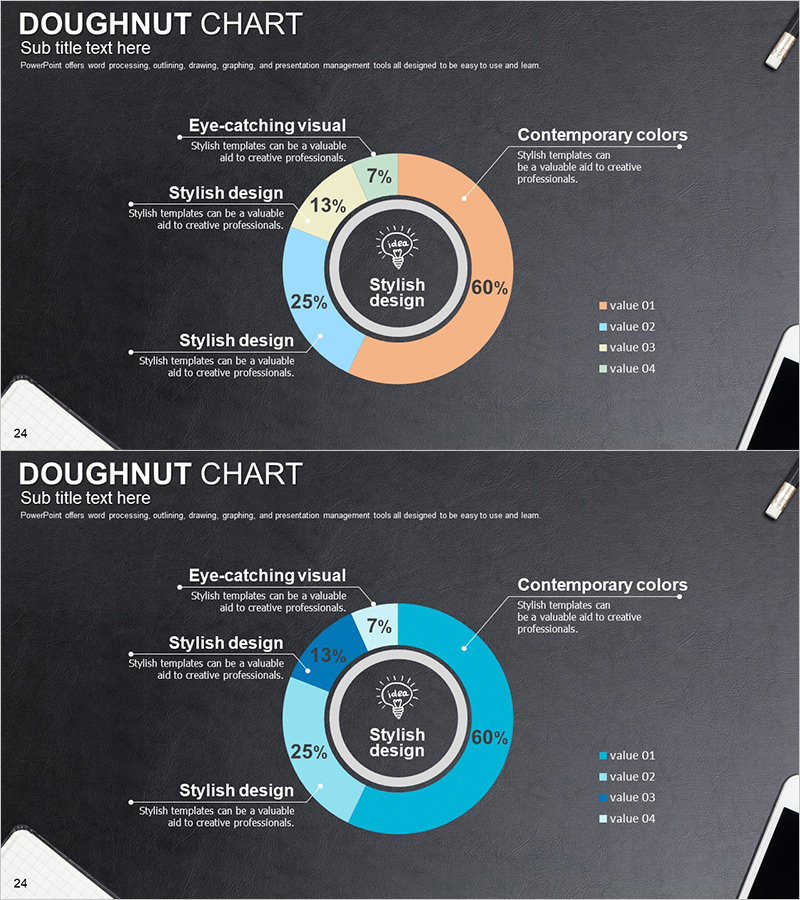
A donut chart PowerPoint slide designed to visualize idea development status and market analysis data. The center circular area highlights key messages while the outer donut ring is divided into 4 segments to represent proportional data. Set against a charcoal gray background, contrasting colors—orange, sky blue, and navy blue—emphasize each segment, with callout bubbles connecting explanatory text. The 2-slide set includes a color variation (orange and blue combination) so you can choose the version that best fits your presentation context. Fully editable in PPTX format, allowing you to customize data values and labels instantly.
Usage Points
-
Main Usage
Ideal for comparing and analyzing 4-item proportional data such as idea development progress rates, market share, business composition ratios, or segment breakdowns. The center circular area can highlight core messages or aggregate figures to reinforce overall context.
-
How to Use
Use in technical presentations, business reports, or marketing analysis materials when explaining composition ratios or progress status. Modify each donut segment's color and values to match your data, add explanatory text in callout bubbles, and select the color combination that aligns with your presentation theme.
-
Recommended For
Recommended for technology managers, business planners, marketing analysts, and executives presenting quantitative data. Particularly effective when comparing 4–5 items such as idea development status, market analysis, business composition, or customer segmentation.
-
Slide Structure
Slide 1: 4-segment donut in orange, sky blue, navy, and light blue + center circular emphasis area + 4 callout bubbles. Slide 2: identical structure with blue, teal, sky blue, and light blue color variation. Percentage values displayed on each segment with legend included.
Related Products
-

Red Purple Highlight Donut Chart - Market Share Analysis
#Business Introduction #Market and Competitor Analysis #Diagram
-

Visualizing Subjects with Donut Charts – A Master of Information Delivery
#Product/Service Introduction #Business Introduction #Market and Competitor Analysis
-

Pie Chart for Data Comparison – Quality and Color
#Business Introduction #Market and Competitor Analysis #Graph
-

Visualizing Market Share with Donut Chart – Effective Business Analysis
#Business Introduction #Market and Competitor Analysis #Graph
