Circular Gradient Wide Template Line chart – Delivering Business Strategy
RJ0200056_7
- Last Update 04/14/2025
- File Size 1.9MB
- # of Slides 2
- File Format PPTX
- Slide Ratio 16:9
- Color
Keywords
About the Product
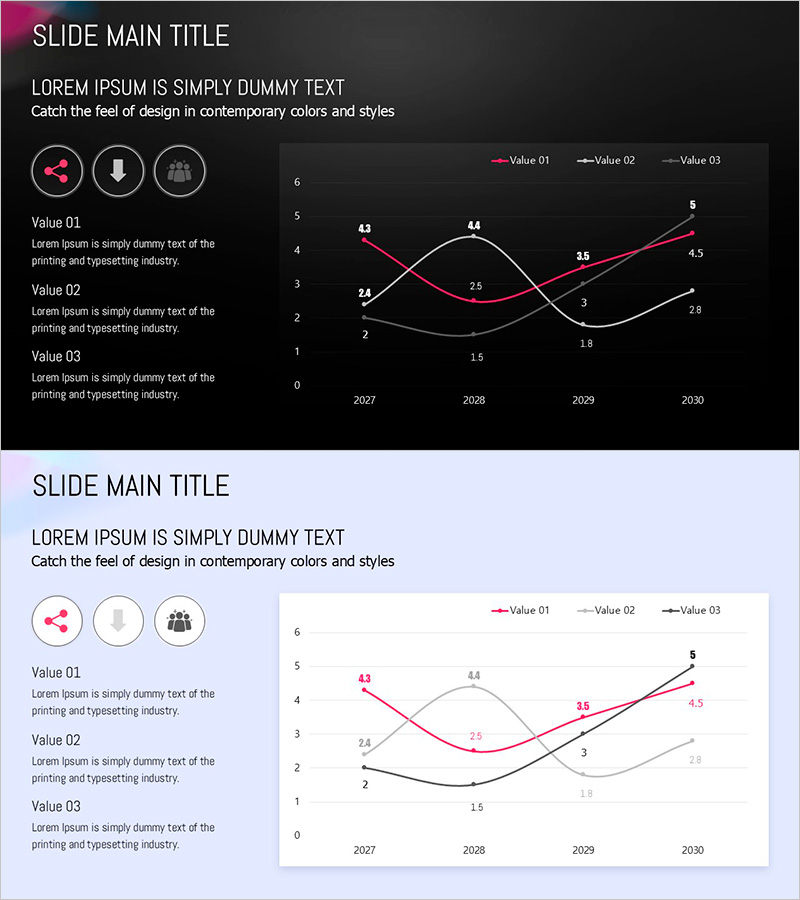
A multi-series line chart PowerPoint slide designed to compare data trends across four years (2027–2030). The slide features a dark background with three distinct data lines in pink, white, and gray, making it ideal for presenting business progress, revenue trends, performance metrics, and strategic forecasts. Each data point is labeled with numerical values for clarity and precision. The 16:9 widescreen format ensures compatibility with modern presentation environments. Perfect for executive reports, quarterly reviews, investor pitches, and strategic planning presentations.
Usage Points
-
Main Usage
Simultaneously compare and analyze multiple data series over time. Effectively communicate business progress, revenue growth, customer satisfaction, market share, and other key performance indicators in a single visual.
-
How to Use
Place your three metric labels and descriptions in the left icon and text area. Input your actual data values into the right-side line chart. Customize line colors, data point labels, and axis values to match your presentation content.
-
Recommended For
Executive reports, quarterly business reviews, investor presentations, strategic planning meetings, and performance analysis. Suitable for finance teams, strategy departments, marketing teams, and sales organizations requiring data-driven decision-making.
-
Slide Structure
Two dark-background slides with consistent layout. Each slide divides into left section (three circular icons with text descriptions) and right section (line chart with X-axis labeled 2027–2030, Y-axis scaled 0–6, three colored data lines, and numerical point labels).
Related Products
-

Mid-to-Long Term Vision & Growth Strategy Roadmap – Business Advancement Timeline
#Business Strategy #Diagram #Graph
-

Visualizing Business Strategy with Line Chart – Risk Management and Strategic Approach
#Business Strategy #Risk Management and Regulatory Compliance #Graph
-

Visualizing Project Progress and Future Prospects – Journey to Success
#Business Strategy #Market and Competitor Analysis #Graph
-

Modern Business Presentation Template Line Chart
#Business Strategy #Market and Competitor Analysis #Graph
