Highlighting Line Graphs in Volume Presentation Template
RJ0200017_14
- Last Update 04/02/2025
- File Size 5.2MB
- # of Slides 2
- File Format PPTX
- Slide Ratio 16:9
- Color
Keywords
- #Content-Based Slides
- #Design-Based Slides
- #Business Strategy
- #Graph
- #Financial Outlook & Expected Impact
- #Line
- #Line Chart
- #Project Progress
- #16:9
- #line chart PowerPoint slide
- #multi-series chart template
- #trend analysis presentation
- #business performance graph
- #revenue forecast chart
- #how to create line chart in PowerPoint
About the Product
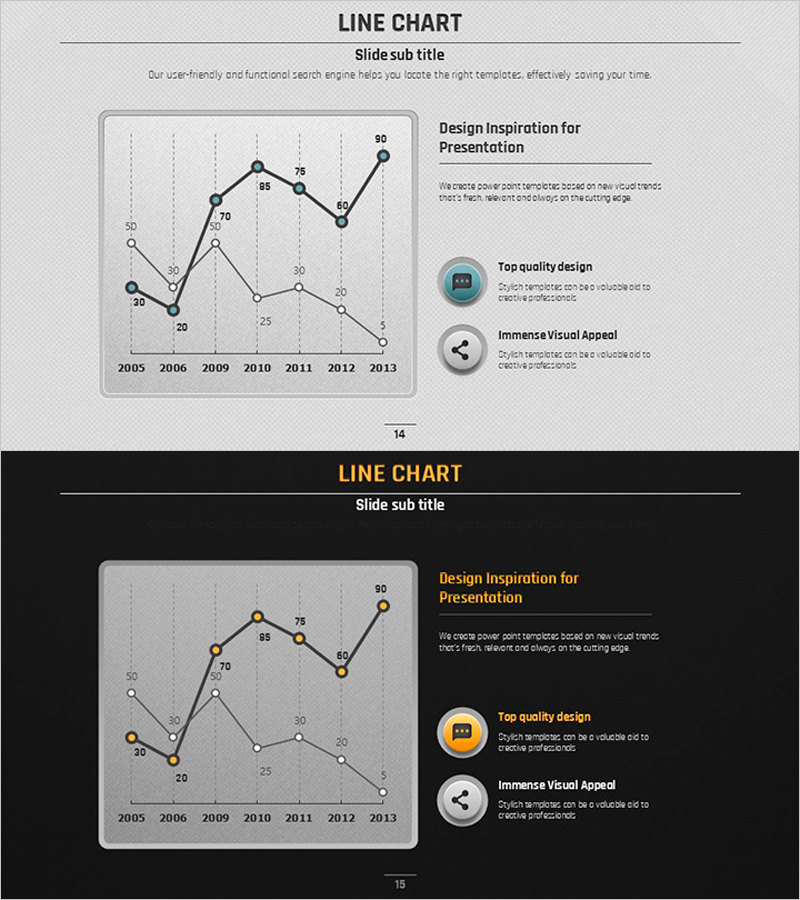
A multi-series line chart PowerPoint slide designed to visualize business performance and revenue forecasts over time. This presentation template displays two data series across a 9-year period (2005–2013) with precise numerical labels at each data point for accurate comparison. The slide features two design variations: a light gray background version with black lines and circular markers, and a black background version with gold accent highlights. Ideal for business reports, financial analysis presentations, investor pitches, and executive dashboards. Fully editable and ready to customize with your own data.
Usage Points
-
Main Usage
Communicate business performance trends and revenue forecasts to executives and investors by visualizing long-term data patterns. The dual-series format enables simultaneous comparison of related metrics, revealing correlations and divergences in key performance indicators.
-
How to Use
Insert into business performance reports, quarterly earnings presentations, annual financial reviews, and investor relations decks. Replace sample data with your actual figures and adjust axis labels to match your reporting period. Compatible with all PowerPoint versions.
-
Recommended For
CFOs, financial analysts, business strategists, investor relations professionals, management consultants, and corporate executives. Suitable for quarterly business reviews, annual shareholder meetings, board presentations, and financial forecasting sessions.
-
Slide Structure
Dual-series line chart with 9 data points per series spanning 2005–2013. Y-axis range 0–90 with gridlines. Each data point labeled with exact numerical value. Two complete design variations provided: light gray background with black lines, and black background with gold accents.
Related Products
-

Premium Management Presentation Line Chart – Business Strategy and Revenue Forecast
#Business Strategy #Graph #Financial Outlook & Expected Impact
-

Mid-to-Long Term Vision & Growth Strategy Roadmap – Business Advancement Timeline
#Business Strategy #Diagram #Graph
-

Modern Business Plan Presentation Template Bubble Diagram – Efficient Planning Visualization
#Business Strategy #Diagram #Graph
-

Progress and Profit Outlook Graph – Harmony of Green and Orange
#Business Strategy #Graph #Financial Outlook & Expected Impact
