Circular Gradient Wide Template Bundled Charts
RJ0200056_5
- Last Update 04/14/2025
- File Size 1.8MB
- # of Slides 2
- File Format PPTX
- Slide Ratio 16:9
- Color
Keywords
- #Content-Based Slides
- #Design-Based Slides
- #Market and Competitor Analysis
- #Graph
- #Market Analysis
- #Competitive Advantage
- #Column
- #Grouped Column
- #16:9
- #grouped bar chart PowerPoint
- #6-item comparison chart template
- #gradient chart slide
- #multi-series data visualization
- #bar graph PowerPoint slide template
About the Product
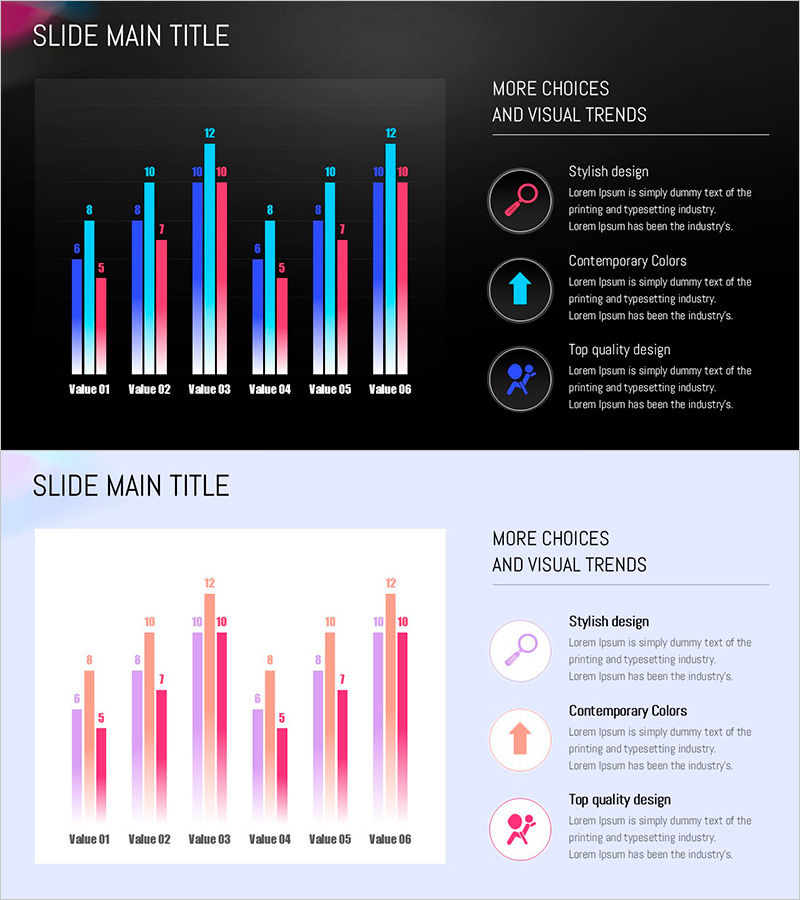
A 2-slide set of grouped bar chart PowerPoint slides for comparing numerical data across 6 items with 3 data series each. Designed with cyan, pink, and red gradient bars on dark and light backgrounds, this chart template provides excellent contrast and visual emphasis for multi-series comparisons. The gradient effect adds depth while maintaining clarity for business presentations, financial reports, and marketing analysis decks. Created in 16:9 widescreen format for modern presentation environments, with fully editable elements for seamless integration into your existing template style.
Usage Points
-
Main Usage
Visualize and compare multi-series numerical data across 6 categories simultaneously. Ideal for displaying sales figures, market share percentages, performance metrics, or survey results where multiple data points per category need clear visual distinction through gradient color coding.
-
How to Use
Use the dark background version for executive presentations and premium business reports; apply the light background version to marketing decks and analytical documents. Data labels above each bar ensure precise value reading, while background gridlines assist in quick numerical comparison. All elements including colors, labels, and layout are fully customizable to match your corporate template standards.
-
Recommended For
Finance, marketing, and sales teams presenting quarterly or annual performance analysis, market research findings, product sales comparisons, customer satisfaction survey results, and KPI dashboards for executive decision-making. Suitable for any data-driven business presentation requiring multi-series numerical comparison.
-
Slide Structure
Slide 1 (dark background): 6 items (Value 01–06) with 3 grouped bars per item (cyan, pink, red gradient) + title area at top + 3 icon-text descriptions on right. Slide 2 (light background): identical layout with bright tone. Each bar features gradient shading for depth; numerical labels and background gridlines enhance readability and data interpretation.
Related Products
-

Comparative Chart Analysis – Optimized for Market and Competitive Analysis
#Market and Competitor Analysis #Graph #Market Analysis
-

Market Competition and Analysis Graphs – Enhance Business Advantage
#Market and Competitor Analysis #Graph #Other
-

Layout Design Presentation Template for Market & Competitor Analysis – Column Chart
#Market and Competitor Analysis #Graph #Customer Analysis
-

Modern Business Plan Template – Clustered Column Graph
#Market and Competitor Analysis #Graph #Market Analysis
