Comparative Chart Analysis – Optimized for Market and Competitive Analysis
RJ0600006_19
- Last Update 06/22/2025
- File Size 2MB
- # of Slides 2
- File Format PPTX
- Slide Ratio 16:9
- Color
Keywords
- #Content-Based Slides
- #Design-Based Slides
- #Market and Competitor Analysis
- #Graph
- #Market Analysis
- #Competitive Advantage
- #Column
- #Line
- #Grouped Column
- #Line Chart
- #16:9
- #line chart PowerPoint
- #bar graph template
- #data comparison slide
- #market analysis chart
- #competitive analysis PowerPoint template
About the Product
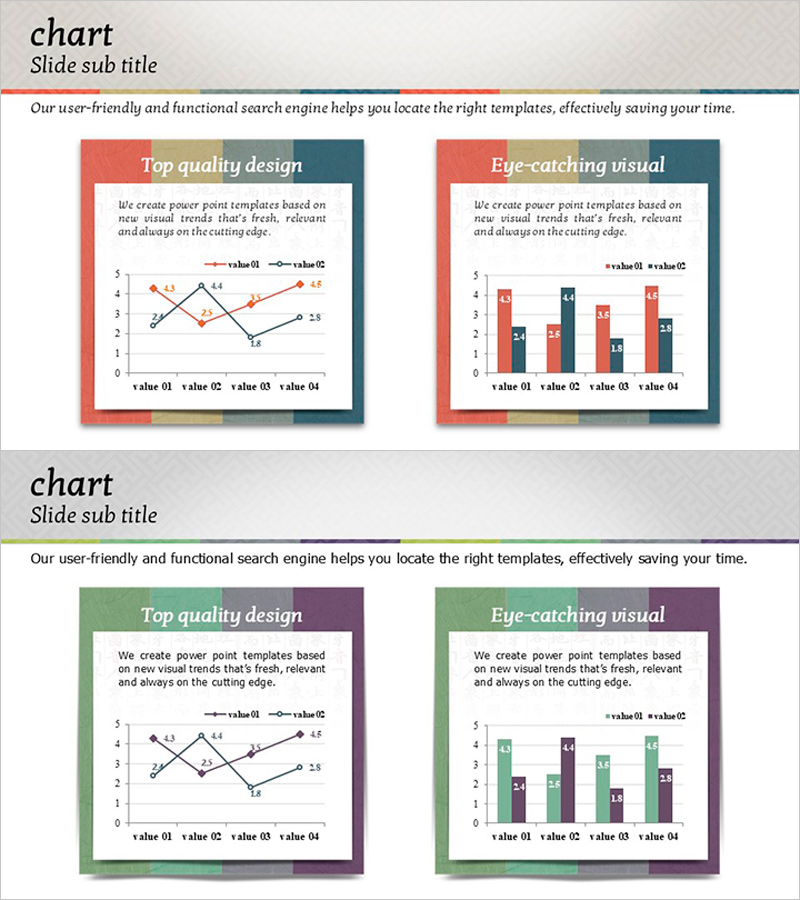
A two-slide PowerPoint template optimized for market analysis and competitive comparison. The first slide features a dual-series line chart displaying trend changes over time, while the second slide uses a horizontal bar chart for direct item-by-item numerical comparison. The design employs contrasting colors—orange, gray, and blue—to clearly distinguish data series. Each slide includes a title, descriptive text area, and legend for complete context. Delivered in editable PPTX format, allowing you to input actual data and integrate the slides directly into your presentation without additional design work.
Usage Points
-
Main Usage
Visualize and compare market trends alongside competitive performance metrics. The line chart illustrates temporal progression while the bar chart enables side-by-side numerical comparison, providing clear evidence for strategic decision-making.
-
How to Use
Deploy in business reports, marketing plans, and investor presentations to showcase market size evolution, revenue trends, customer satisfaction benchmarks, and competitive positioning. Simply replace the sample data values and legend labels with your actual figures to create a polished presentation.
-
Recommended For
Strategy planning, marketing, finance, and sales teams presenting quarterly or annual performance reviews, market share analysis, and competitive advantage assessments. Particularly suited for executive-level reports requiring multi-series data visualization.
-
Slide Structure
Slide 1: Dual-series line chart (orange and gray) with 4 X-axis values, legend, title, and description area. Slide 2: Horizontal bar chart (orange and blue) with 4 items, legend, title, and description area. 16:9 widescreen format, fully editable PPTX.
Related Products
-

Line Graph and Clustered Column Graph – Essential for Competitor Analysis
#Market and Competitor Analysis #Graph #Competitor Analysis
-

Analyzing 2 Comparison Graphs - Slides for Deriving Competitive Advantage
#Market and Competitor Analysis #Graph #Competitor Analysis
-

Graph Analysis of Growth – Data Visualization for Competitive Advantage
#Market and Competitor Analysis #Diagram #Graph
-

Layout Design Presentation Template for Market & Competitor Analysis – Column Chart
#Market and Competitor Analysis #Graph #Customer Analysis
