Circular Gradient Wide Template Table – Market Analysis and Financial Performance
RJ0200056_24
- Last Update 04/14/2025
- File Size 1.7MB
- # of Slides 2
- File Format PPTX
- Slide Ratio 16:9
- Color
Keywords
- #Content-Based Slides
- #Design-Based Slides
- #Market and Competitor Analysis
- #Financial Plans and Performance
- #Diagram
- #Competitor Analysis
- #Sales and Revenue
- #Table
- #16:9
- #comparison analysis table PowerPoint
- #financial data slide
- #market analysis presentation
- #two-column layout table
- #competitive analysis slide
About the Product
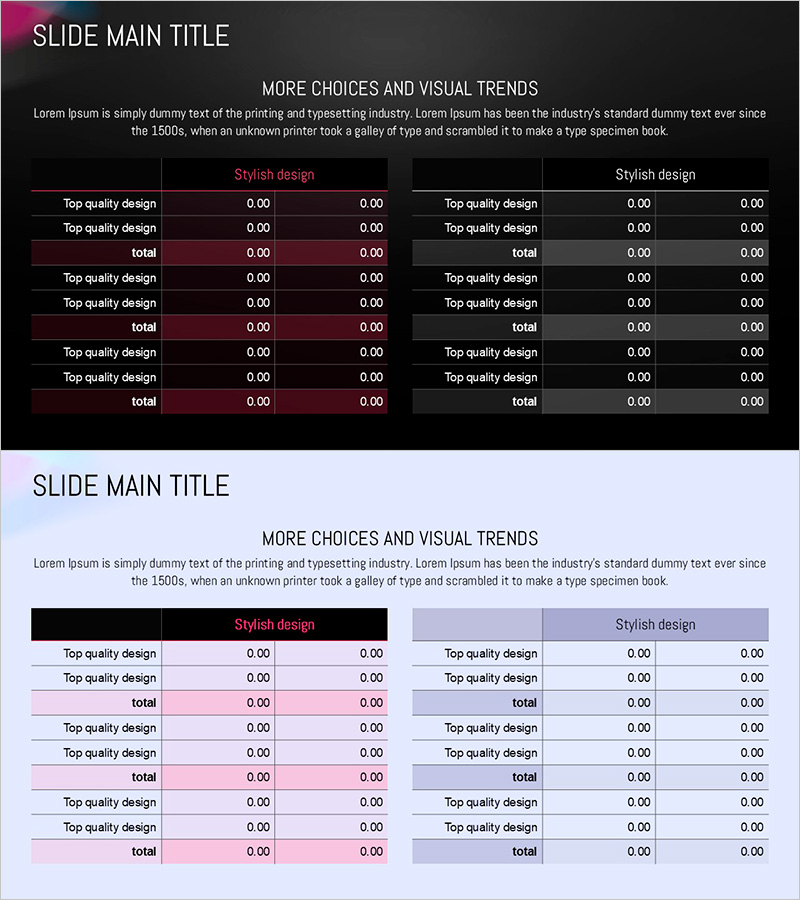
A 2-slide PowerPoint template designed to compare market analysis and financial performance side by side. Features a pink gradient and gray tone contrast layout with a two-column table structure for presenting comparative data. Each slide includes a 'Stylish design' header and multiple rows of data entry fields, making it ideal for visualizing competitive analysis, financial metrics, and market share information. Ready to use in presentations, reports, and investor pitch decks.
Usage Points
-
Main Usage
A side-by-side comparison slide that presents two items simultaneously using a two-column structure. Organizes numerical data in table format to clearly demonstrate financial metrics, market conditions, or competitive benchmarks for informed decision-making.
-
How to Use
Simply enter your numerical data into the table cells on each slide. The pink header section and gray header section are clearly separated, allowing you to contrast two scenarios, time periods, or departments. Highly effective for emphasizing numerical comparisons during presentations.
-
Recommended For
Ideal for finance teams, strategy departments, and marketing teams preparing quarterly or annual performance reports, investor pitch decks, and executive briefing materials. Suitable for any presentation requiring market analysis, competitive benchmarking, or financial performance comparison.
-
Slide Structure
Two-slide deck with consistent layout. Each slide contains a title area at the top and a dual-table section in the center. The left table (pink header) and right table (gray header) are symmetrically positioned, with each table providing 5-6 rows for data entry.
Related Products
-

Red Orange Curved Line Trend Analysis – Market Insights
#Market and Competitor Analysis #Financial Plans and Performance #Diagram
-

Comparison Table Slide – Market and Competitor Analysis
#Market and Competitor Analysis #Financial Plans and Performance #Diagram
-

Triangle Pattern Column Chart Presentation Template
#Market and Competitor Analysis #Financial Plans and Performance #Diagram
-

Competitor Analysis Chart – Visualizing Market and Financial Performance
#Market and Competitor Analysis #Financial Plans and Performance #Diagram
