Analysis of Brand Logos by Competitors – Market Insights and Visual Data
RM0100009_32
- Last Update 01/27/2025
- File Size 0.6MB
- # of Slides 2
- File Format PPTX
- Slide Ratio 16:9
- Color
Keywords
- #Content-Based Slides
- #Design-Based Slides
- #Market and Competitor Analysis
- #Financial Plans and Performance
- #Diagram
- #Competitor Analysis
- #Sales and Revenue
- #Table
- #16:9
- #estimated income statement PowerPoint slide
- #comparison table design
- #market analysis slide
- #competitive analysis PPT
- #financial data visualization template
About the Product
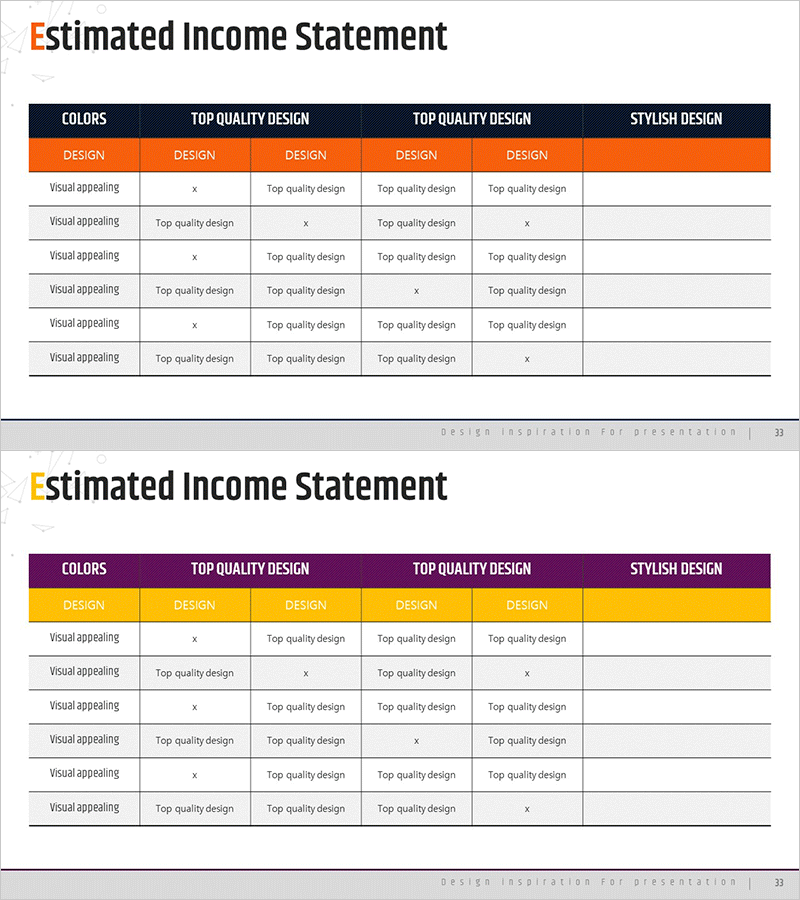
A PowerPoint slide for analyzing estimated income statements with comparative data visualization. Features a dark header row and three-color table design (orange, purple, white) displaying design quality ratings across multiple columns. Ideal for market analysis, competitive analysis, and financial planning presentations. The 2-slide deck in 16:9 PPTX format is fully editable and optimized for presenting complex financial data and performance metrics at a glance. Perfect for investor pitches, board reports, and strategic business reviews.
Usage Points
-
Main Usage
Visualize estimated income statements, competitive benchmarks, and market data in a structured table format to support decision-making. The multi-color table enables side-by-side comparison of multiple items using consistent evaluation criteria, with design quality ratings displayed in each column for quantitative assessment.
-
How to Use
Insert into IR presentations, business plan reports, or market analysis documents in the data comparison section. Edit header text and cell content to input actual financial data, and use the color-coded table to indicate performance ratings or evaluation results by category. Enables credible information delivery to investors, executives, and business partners.
-
Recommended For
Finance managers, marketing strategists, business development professionals, management consultants, and investment analysts presenting market conditions, competitive positioning, and financial metrics. Particularly effective when comparing multiple companies, products, or performance indicators simultaneously in executive presentations.
-
Slide Structure
2-slide deck with each slide containing one title area and one comparison table. Tables feature 6-7 rows and 4-5 columns with dark header row and color-coded data rows (orange, purple, white). Each cell accommodates text input or evaluation symbols (checkmark, cross) for flexible data representation.
Related Products
-

Volume Presentation Template with Tables and Clustered Charts – Efficient Data Analysis
#Market and Competitor Analysis #Financial Plans and Performance #Diagram
-

Comparison Table Slide – Market and Competitor Analysis
#Market and Competitor Analysis #Financial Plans and Performance #Diagram
-

Competitor Analysis Chart – Visualizing Market and Financial Performance
#Market and Competitor Analysis #Financial Plans and Performance #Diagram
-

Triangle Pattern Column Chart Presentation Template
#Market and Competitor Analysis #Financial Plans and Performance #Diagram
