Competitor Analysis Chart – Visualizing Market and Financial Performance
RM0100012_32
- Last Update 01/28/2025
- File Size 1.3MB
- # of Slides 2
- File Format PPTX
- Slide Ratio 16:9
- Color
Keywords
- #Content-Based Slides
- #Design-Based Slides
- #Market and Competitor Analysis
- #Financial Plans and Performance
- #Diagram
- #Competitor Analysis
- #Sales and Revenue
- #Table
- #16:9
- #competitor analysis PowerPoint slide
- #competitor comparison table template
- #market analysis slide
- #financial performance comparison PPT
- #competitive analysis chart design
About the Product
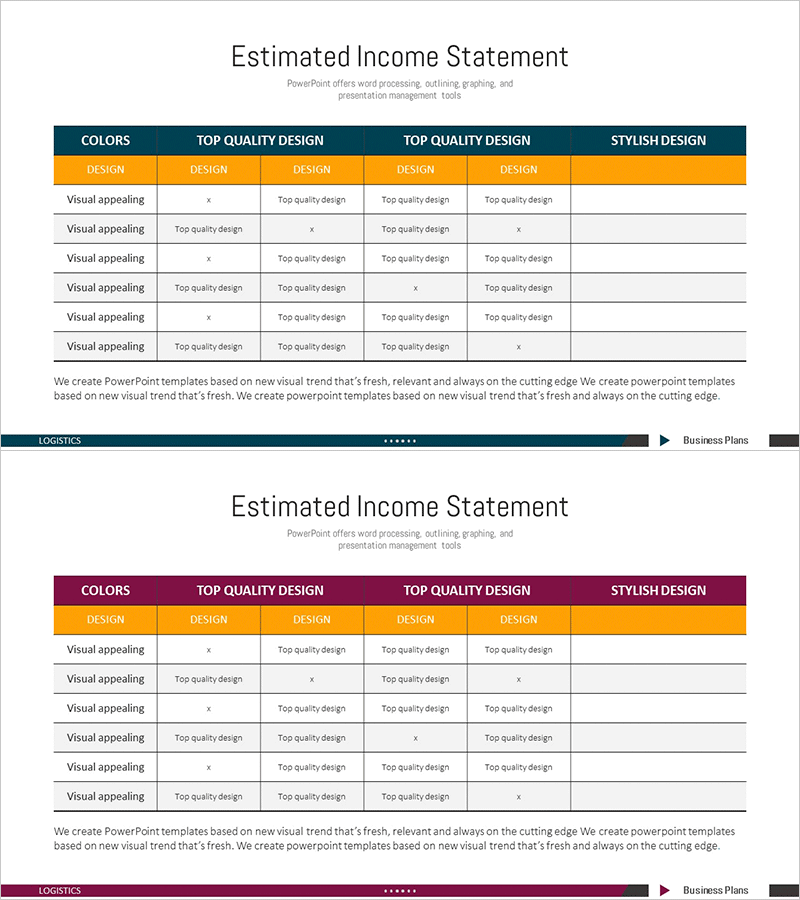
A professional competitor analysis PowerPoint slide that visualizes market and financial performance across multiple competitors. The table structure features dark blue, wine, and teal color-coded headers to distinguish each competitor's metrics clearly. This 2-slide presentation template combines checkmarks and text input areas to display both qualitative and quantitative data simultaneously. Ideal for investor pitches, executive briefings, and strategic planning sessions where competitive positioning needs to be communicated effectively.
Usage Points
-
Main Usage
This slide enables side-by-side comparison of competitors across multiple dimensions such as market share, revenue, technology capabilities, and customer satisfaction. Color-coded headers visually distinguish each competitor, making it easy for investors, partners, and stakeholders to understand your competitive position at a glance.
-
How to Use
Enter competitor names in each column and comparison criteria (market share, revenue, technology, customer satisfaction, etc.) in each row. Use checkmarks and text fields to combine qualitative assessments with quantitative metrics. Ready to integrate into pitch decks, strategic planning documents, and quarterly business reviews.
-
Recommended For
Executives, strategy teams, marketing departments, and investor relations professionals presenting competitive analysis. Perfect for business plans, investor pitch decks, quarterly earnings reports, and new business proposals where competitive benchmarking is essential.
-
Slide Structure
2-slide template with title area and multi-row, multi-column table on each slide. Tables accommodate 3–5 competitor columns and 5–7 comparison criteria rows. Color-coded headers (dark blue, wine, teal) distinguish columns. Flexible structure supports text, numbers, and checkmark entries.
Related Products
-

Analysis of Brand Logos by Competitors – Market Insights and Visual Data
#Market and Competitor Analysis #Financial Plans and Performance #Diagram
-

Circular Gradient Wide Template Table – Market Analysis and Financial Performance
#Market and Competitor Analysis #Financial Plans and Performance #Diagram
-

Triangle Pattern Column Chart Presentation Template
#Market and Competitor Analysis #Financial Plans and Performance #Diagram
-

Volume Presentation Template with Tables and Clustered Charts – Efficient Data Analysis
#Market and Competitor Analysis #Financial Plans and Performance #Diagram
