Circular Gradient Wide Template Bar for Visualizing Performance
RJ0200056_22
- Last Update 04/14/2025
- File Size 1.8MB
- # of Slides 2
- File Format PPTX
- Slide Ratio 16:9
- Color
Keywords
- #Content-Based Slides
- #Design-Based Slides
- #Business Strategy
- #Market and Competitor Analysis
- #Graph
- #Achievements
- #Competitive Advantage
- #Horizontal Bar
- #Grouped Horizontal Bar
- #16:9
- #horizontal bar chart PowerPoint
- #bar graph slide template
- #data visualization PPT
- #performance comparison chart
- #gradient background presentation slide
About the Product
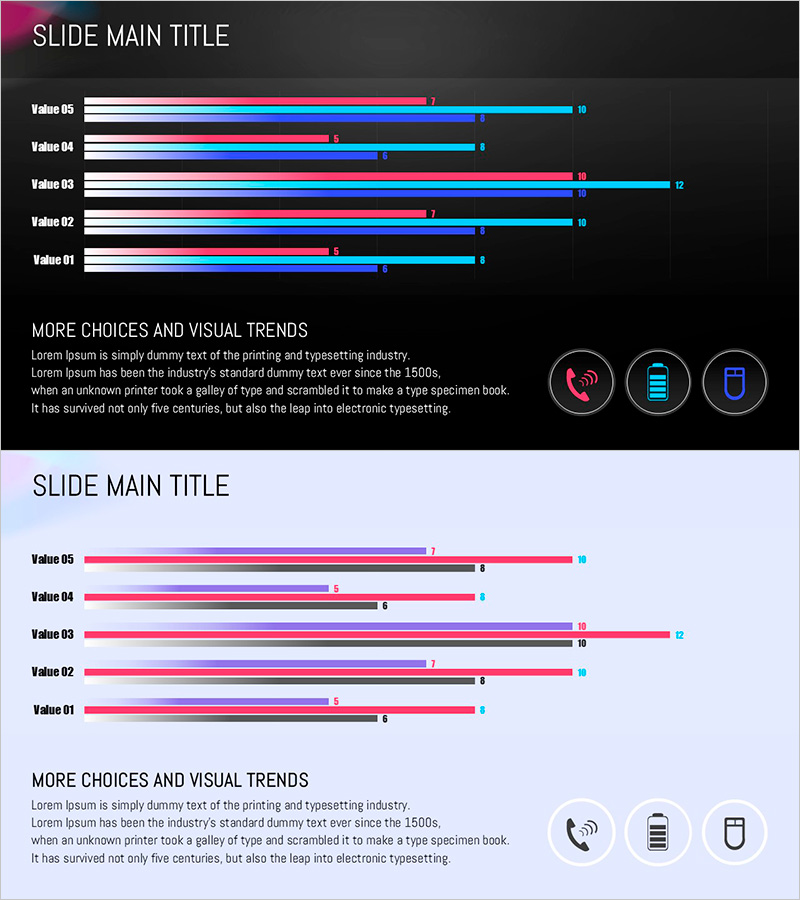
A PowerPoint slide featuring a 5-item horizontal bar chart with circular gradient background transitioning from magenta to cyan. Each bar is color-coded in distinct hues (magenta, pink, blue, cyan) to clearly differentiate data values and enable quick comparison. The 2-slide deck includes a chart-focused first slide and a second slide with three circular icons and text areas for insights and analysis. Ideal for performance reporting, market analysis, competitive benchmarking, and sales comparisons. Fully editable PPTX format allows you to customize all data labels, values, colors, and text for immediate presentation use.
Usage Points
-
Main Usage
Designed to compare and rank five data points using horizontal bars with distinct color coding. The circular gradient background (magenta to cyan) and multi-color bars emphasize data differences and capture audience attention. Perfect for presenting performance metrics, market share, competitive analysis, sales figures, and quantitative business insights.
-
How to Use
Customize the first slide by entering your data labels (Value 01–05) and corresponding numerical values into the bar chart. Adjust bar lengths and colors to match your actual data. Use the second slide's three circular icons and text areas to provide graph interpretation, key findings, and supporting commentary. All elements are fully editable in PPTX format for immediate deployment.
-
Recommended For
Sales and marketing teams presenting quarterly performance reports, executive briefings on business metrics, market research findings, competitive benchmarking analysis, and product sales comparisons. Suitable for investor presentations, client proposals, data-driven decision-making meetings, and strategic planning sessions.
-
Slide Structure
Slide 1: Title area + 5-item horizontal bar chart with Value 01–05 labels, multi-color bars (magenta, pink, blue, cyan), and numerical value indicators. Slide 2: Title area + 3 circular icons (phone, database, security symbols) + text description zones. Full 16:9 widescreen format; all text, colors, values, and icons are fully customizable in PPTX.
Related Products
-

Quarterly Sales Comparison – Market Performance and Competitive Advantage
#Business Strategy #Market and Competitor Analysis #Graph
-

Bundled Graph for Market Performance Analysis – Leveraging Competitive Advantage
#Business Strategy #Market and Competitor Analysis #Graph
-

Data Analysis PPT for Households with Pets
#Business Strategy #Market and Competitor Analysis #Graph
-

Graph for Economic Growth and Competitive Advantage Visualization
#Business Strategy #Market and Competitor Analysis #Graph
