Horizontal Bar Chart Slide Visualizing Airplane Passenger Trends
RJ0600085_18
- Last Update 07/13/2025
- File Size 0.6MB
- # of Slides 2
- File Format PPTX
- Slide Ratio 16:9
- Color
Keywords
- #Content-Based Slides
- #Design-Based Slides
- #Business Strategy
- #Graph
- #Achievements
- #Horizontal Bar
- #Grouped Horizontal Bar
- #16:9
- #horizontal bar chart PowerPoint
- #airplane passenger trends slide
- #bar graph template
- #year-over-year comparison
- #business performance presentation
- #travel industry slides
About the Product
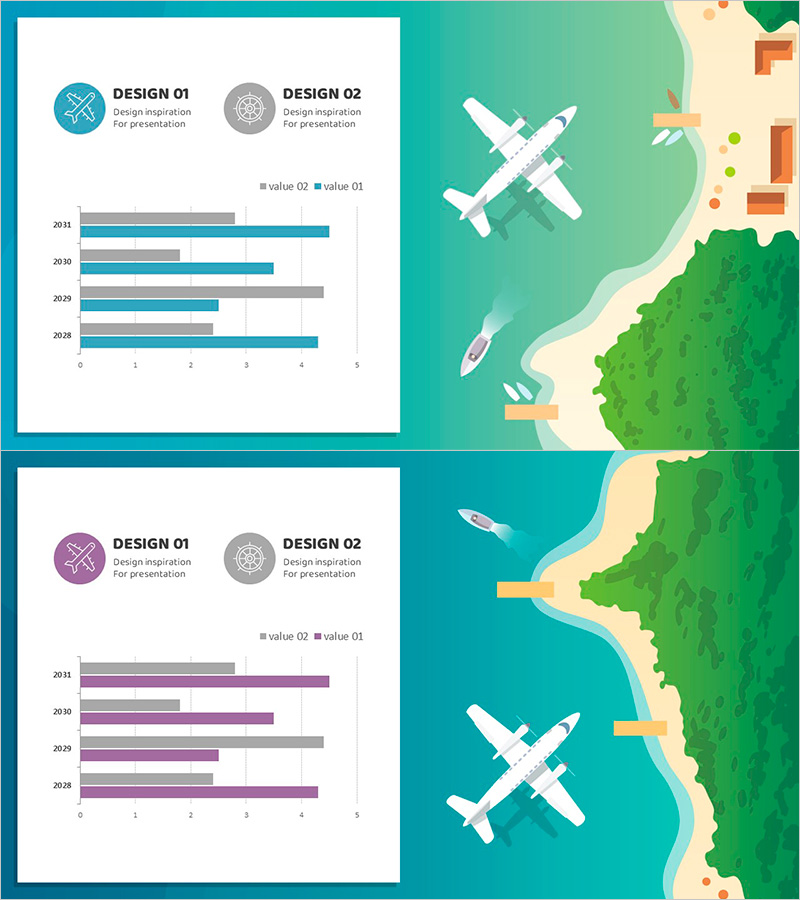
A horizontal bar chart PowerPoint slide tracking airplane passenger volume changes across five years (2011–2028). Offered in two design options—teal and purple—each displaying dual data series (value 01 and value 02) side by side for direct year-over-year comparison. Delivered as a 2-slide deck in 16:9 widescreen format, ready for immediate use in aviation, travel, tourism, and logistics industry presentations. Ideal for performance analysis, business strategy updates, market trend reports, and investor briefings. Bar length intuitively conveys data magnitude, making temporal trends instantly recognizable.
Usage Points
-
Main Usage
Visualize and compare airline passenger volume fluctuations across five-year periods by year and data series. Communicate long-term industry trends through intuitive bar-length comparison, supporting executive briefings, strategic planning, market analysis presentations, and stakeholder reporting.
-
How to Use
Select either the teal or purple design variant to match corporate branding. Replace placeholder values with actual passenger data and update legend labels (value 01 & value 02) to reflect your specific metrics. Emphasize bar-length comparisons during presentation to enhance audience comprehension of year-over-year trends.
-
Recommended For
Airlines and aviation operators presenting quarterly/annual performance reports, travel agencies and tourism boards analyzing market dynamics, logistics and transportation firms evaluating operational metrics, investor relations teams conducting business briefings, academic researchers presenting industry statistics.
-
Slide Structure
Slide 1 (teal): Five years (2011–2028) with dual horizontal bars per year (gray + teal), 0–5 horizontal axis scale, dual-series legend. Slide 2 (purple): Identical structure with five years, dual bars per year (gray + purple), 0–5 scale, dual-series legend. Total 2 slides, 16:9 widescreen format.
Related Products
-

Circular Gradient Wide Template Bar for Visualizing Performance
#Business Strategy #Market and Competitor Analysis #Graph
-

Analysis of Comparative Graphs by Year – Clear Visualization of Market Trends
#Business Strategy #Market and Competitor Analysis #Graph
-

Green Red Year Bundled Graph
#Business Strategy #Market and Competitor Analysis #Graph
-

Quarterly Sales Comparison – Market Performance and Competitive Advantage
#Business Strategy #Market and Competitor Analysis #Graph
