Bundled Graph for Market Performance Analysis – Leveraging Competitive Advantage
RJ0600068_7
- Last Update 07/08/2025
- File Size 4.5MB
- # of Slides 2
- File Format PPTX
- Slide Ratio 16:9
- Color
Keywords
- #Content-Based Slides
- #Design-Based Slides
- #Business Strategy
- #Market and Competitor Analysis
- #Graph
- #Achievements
- #Competitive Advantage
- #Horizontal Bar
- #Grouped Horizontal Bar
- #16:9
- #grouped horizontal bar chart PowerPoint
- #dual series bar graph template
- #competitive analysis slide
- #market performance comparison chart
- #how to create grouped bar chart in PowerPoint
About the Product
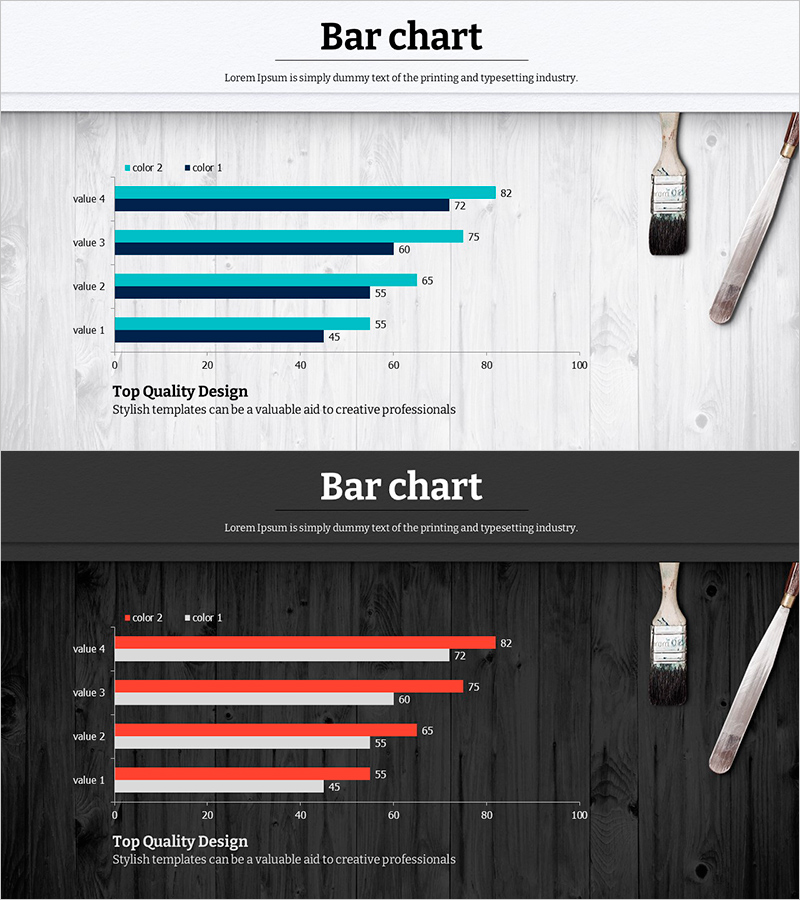
A grouped horizontal bar chart PowerPoint slide optimized for competitive analysis and market performance comparison. This presentation template features two design variations with light wood and dark wood backgrounds, using navy-cyan and red-white color schemes respectively. Each of the 5 items displays two data series side by side, enabling clear visual comparison of competitive advantage and performance metrics. Numeric labels are prominently displayed for each bar, making it ready for immediate use in business presentations and reports. Provided in 16:9 widescreen PPTX format with fully editable colors, values, and item labels.
Usage Points
-
Main Usage
Visualizes two or more data series simultaneously for competitive performance comparison, market share analysis, departmental or product performance benchmarking, and strategic metrics. Clear numeric labels support quantitative evidence presentation in strategy meetings and executive reports.
-
How to Use
Replace item names (value 1–4) and numeric values (45–82) with your own data. Choose between the light wood background or dark wood background version based on your presentation environment and document tone. Colors can be easily customized to match corporate brand guidelines.
-
Recommended For
Ideal for executives, marketing teams, sales teams, and strategic planning departments presenting competitive analysis, market performance reviews, and departmental comparisons. Particularly useful in business plans, quarterly management reports, investor pitch decks, and marketing strategy documents' market analysis sections.
-
Slide Structure
2-slide set. Each slide features 5 items (value 1–4 plus additional item) with grouped horizontal bars representing two data series arranged side by side. Available in light wood background version (cyan and navy tones) and dark wood background version (red and white tones), with numeric labels displayed at the end of each bar.
Related Products
-

Quarterly Sales Comparison – Market Performance and Competitive Advantage
#Business Strategy #Market and Competitor Analysis #Graph
-

Circular Gradient Wide Template Bar for Visualizing Performance
#Business Strategy #Market and Competitor Analysis #Graph
-

Red Black Curved Line Trend – Market Analysis and Competitive Advantage
#Business Strategy #Market and Competitor Analysis #Graph
-

Children's Depression Index Trends – Insights Through Customer Analysis
#Market and Competitor Analysis #Graph #Customer Analysis
