Quarterly Sales Comparison – Market Performance and Competitive Advantage
RJ0800006_4
- Last Update 03/18/2025
- File Size 0.7MB
- # of Slides 4
- File Format PPTX
- Slide Ratio 16:9
- Color
Keywords
- #Content-Based Slides
- #Design-Based Slides
- #Business Strategy
- #Market and Competitor Analysis
- #Graph
- #Achievements
- #Project Staffing
- #Competitive Advantage
- #Horizontal Bar
- #Grouped Horizontal Bar
- #16:9
- #grouped bar chart PowerPoint
- #horizontal bar graph slide
- #sales comparison template
- #market performance chart
- #competitive analysis slide
About the Product
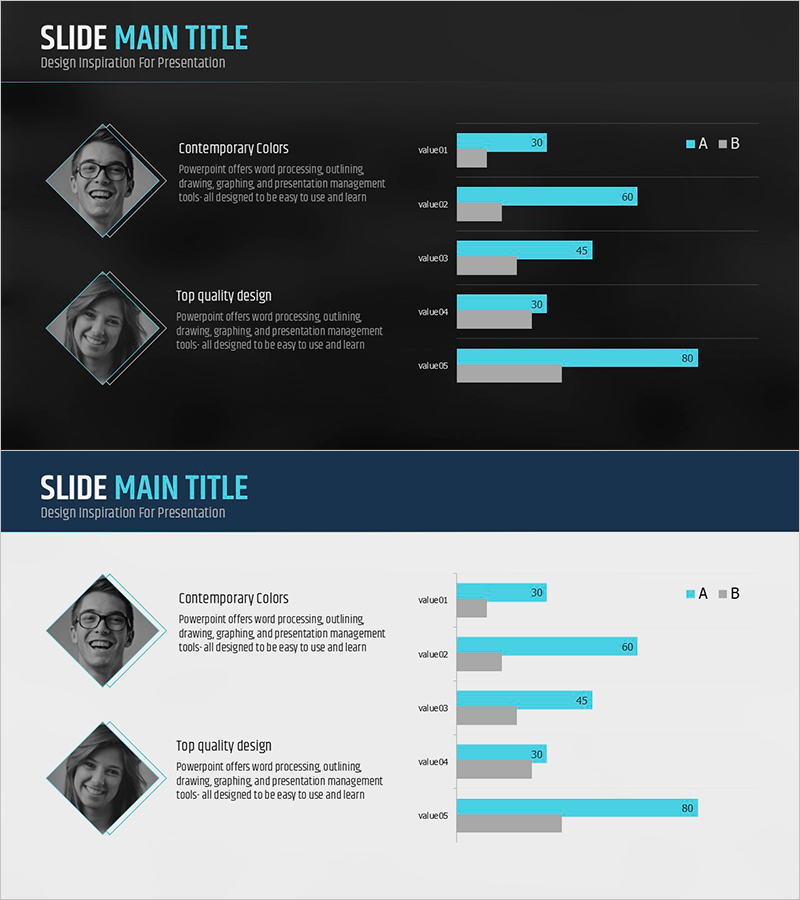
A grouped horizontal bar chart PowerPoint slide that visualizes quarterly sales volume and market performance metrics. The design features a dark gray background with cyan blue bars arranged side-by-side to compare two data series (A and B), enabling clear competitive performance analysis. The 4-slide set includes profile photo frames on the left with text areas for speaker information or additional context, while the right side displays grouped bar charts with labeled values. This presentation template is ready to use for business reports, strategic presentations, and market analysis documents.
Usage Points
-
Main Usage
Designed to compare two or more data series side-by-side, such as quarterly sales figures, market performance metrics, and competitive benchmarks. The grouped bar layout allows viewers to instantly compare values across categories and identify performance gaps between series A and B.
-
How to Use
Use in business strategy meetings, quarterly performance reports, market analysis presentations, and competitive positioning documents. Enter speaker information in the left profile area and input actual sales data into the chart fields to create presentation-ready slides immediately.
-
Recommended For
Sales managers, marketing professionals, business development teams, financial analysts, and executives preparing quarterly performance reviews and competitive analysis reports. Ideal for situations requiring multi-product, multi-region, or multi-segment performance comparisons.
-
Slide Structure
4-slide set with grouped horizontal bar charts displaying 5 data items (value01 through value05) per slide. Each item shows two parallel bars representing series A and B, with numeric labels on the right. Left side includes diamond-framed profile photo area and text fields for titles and descriptions.
Related Products
-

Circular Gradient Wide Template Bar for Visualizing Performance
#Business Strategy #Market and Competitor Analysis #Graph
-

Bundled Graph for Market Performance Analysis – Leveraging Competitive Advantage
#Business Strategy #Market and Competitor Analysis #Graph
-

Horizontal Bar Chart for Construction Project Performance Analysis – Stability and Growth
#Market and Competitor Analysis #Diagram #Graph
-

Analysis of Climbing Success Rate with Doughnut Chart
#Business Strategy #Market and Competitor Analysis #Graph
