Circular Gradient Wide Template Donut Chart3
RJ0200056_11
- Last Update 04/14/2025
- File Size 1.8MB
- # of Slides 2
- File Format PPTX
- Slide Ratio 16:9
- Color
Keywords
About the Product
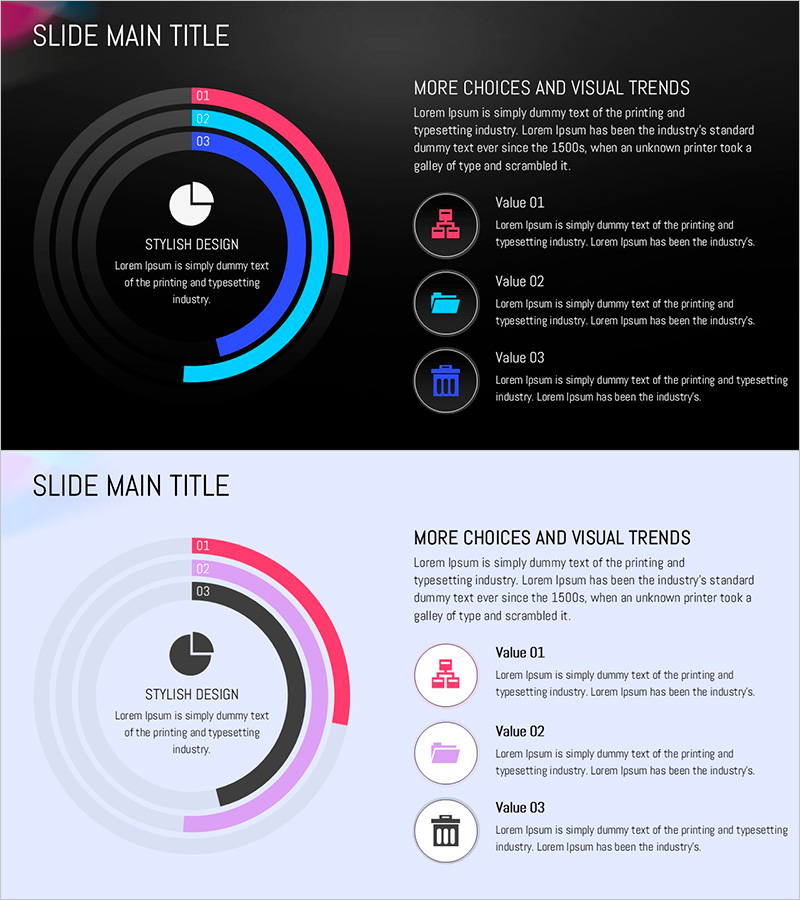
A donut-shaped pie chart PowerPoint slide designed to visualize the proportion of three data categories. The design features gradient rings in pink, blue, and gray, with a central pie chart and icon-based description area on the right. The 2-slide set offers multiple color variations (dark background and light background) to match your presentation theme. Fully editable PPTX format allows you to quickly update values and labels. Ideal for business presentations, marketing reports, strategy briefings, and quarterly performance reviews.
Usage Points
-
Main Usage
Effectively communicates the proportional relationship of three data categories such as sales composition, market share, budget allocation, or customer distribution. The donut ring structure creates a central space for additional information (totals, key metrics), enabling high information density.
-
How to Use
Input your data values into the left donut chart, then populate the right side Value 01, 02, and 03 sections with category names and descriptions. Icons can be customized to match your content, and the gradient rings provide visual emphasis. Choose between dark or light background versions to align with your overall presentation design.
-
Recommended For
Recommended for executives, marketing teams, planning departments, and sales teams presenting financial analysis, marketing performance reports, organizational structure, customer segmentation, or product portfolio proportions. Highly effective for quarterly performance reports, strategy meetings, and investor presentations.
-
Slide Structure
Slide 1 (dark background): Left side features a donut-shaped 3-segment gradient ring (pink, blue, gray) with central pie chart; right side contains 3 icons with Value text areas. Slide 2 (light background): Identical structure with adjusted color tone. 16:9 widescreen format, 2-slide PPTX file.
Related Products
-

Drug Problem Analysis Donut Circle Graph
#Product/Service Introduction #Market and Competitor Analysis #Graph
-

Status of Research and Development by Topic – Innovation and Trust
#Product/Service Introduction #Market and Competitor Analysis #Diagram
-

Mobile App Market Share Analysis Graph
#Product/Service Introduction #Market and Competitor Analysis #Diagram
-

Progress Timeline – Visualization of Business Strategies
#Product/Service Introduction #Business Strategy #Diagram
