Internet of Things User Analysis Status – Customer Insights and Data Visualization
RJ0400049_6
- Last Update 05/30/2025
- File Size 0.2MB
- # of Slides 2
- File Format PPTX
- Slide Ratio 16:9
- Color
Keywords
- #Content-Based Slides
- #Design-Based Slides
- #Product/Service Introduction
- #Market and Competitor Analysis
- #Graph
- #Other
- #Development Status
- #Customer Analysis
- #Circles
- #Doughnut Chart
- #16:9
- #donut chart PowerPoint slide
- #pie graph presentation template
- #data visualization slides
- #percentage display PPT
- #user analysis presentation
- #customer insights slide template
About the Product
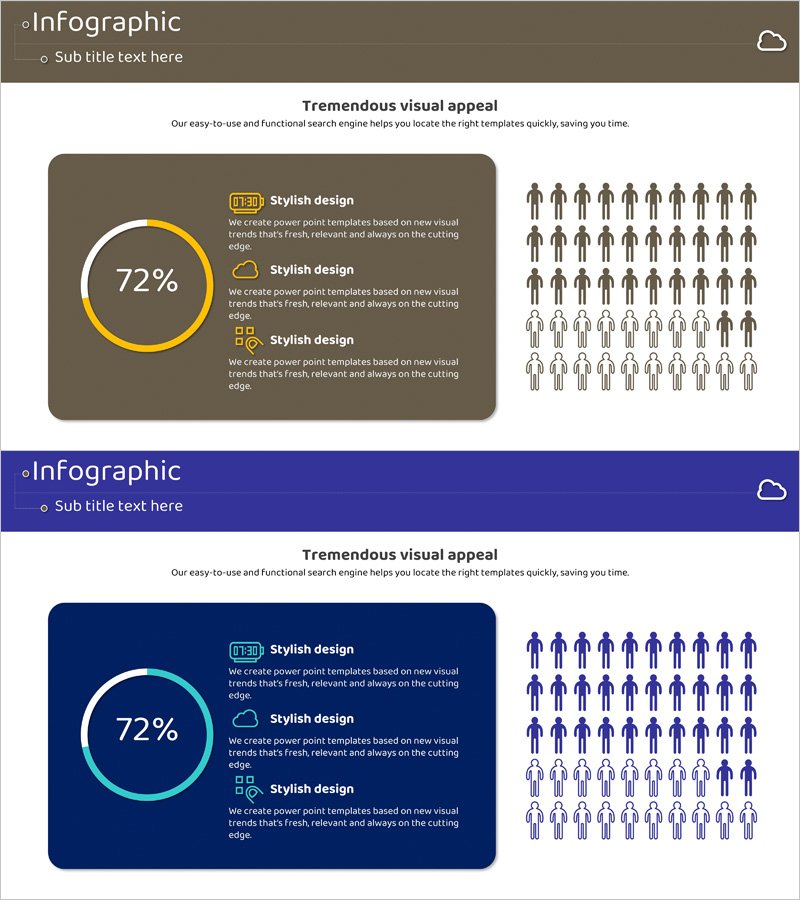
A professional donut chart PowerPoint slide set designed for Internet of Things user analysis and customer insights visualization. The 2-slide template features a prominent 72% donut graph in the center with 30 insight icons arranged on the right side, effectively communicating market data and user statistics at a glance. The brown and navy blue backgrounds are accented with yellow and cyan ring highlights to create visual contrast and maintain audience focus during presentations. Each slide includes header sections for titles and subtitles, plus three text input boxes for detailed explanations and supporting information.
Usage Points
-
Main Usage
Visualizes single-metric data such as IoT market analysis, user adoption rates, customer satisfaction surveys, and demographic distributions using a prominent donut graph. The center-focused percentage design immediately draws attention to key metrics, while the right-side icon grid systematically organizes supporting data points.
-
How to Use
Ideal for IT, telecommunications, and IoT companies presenting business reports, market analysis, and investor pitches. Select either the brown or navy background to match corporate branding, then populate the text boxes with specific metrics and descriptions. Easily customizable for various data types and presentation contexts.
-
Recommended For
Data analysts, marketing professionals, business strategists, and IT executives preparing statistics-based presentations. Particularly suited for executive briefings, investor relations meetings, academic presentations, and market research reports where a single key metric requires emphasis.
-
Slide Structure
2-slide set with consistent layout. Each slide contains: top header section (brown or navy background with title and subtitle areas), left-aligned donut graph (72% center value with yellow or cyan ring accent), right-side icon grid (30 icons in 5×6 arrangement), and bottom section with three text input boxes for additional details.
Related Products
-

User Analysis Status by Year – Growth and Change
#Product/Service Introduction #Market and Competitor Analysis #Graph
-

Target Market Analysis Graph – Visualized Data Insights
#Product/Service Introduction #Market and Competitor Analysis #Graph
-

Data Analysis Status Pie Chart – A Tool for Clear Understanding
#Product/Service Introduction #Graph #Other
-

Chemical Experiment Analysis Circle Graph – Effective Data Visualization
#Product/Service Introduction #Graph #Other
