Donut Chart: Nutrient Ratio by Ingredient – Simple and Intuitive Representation
RB0700013-1_5
- Last Update 03/16/2025
- File Size 2.1MB
- # of Slides 2
- File Format PPTX
- Slide Ratio 4:3
- Color
Keywords
About the Product
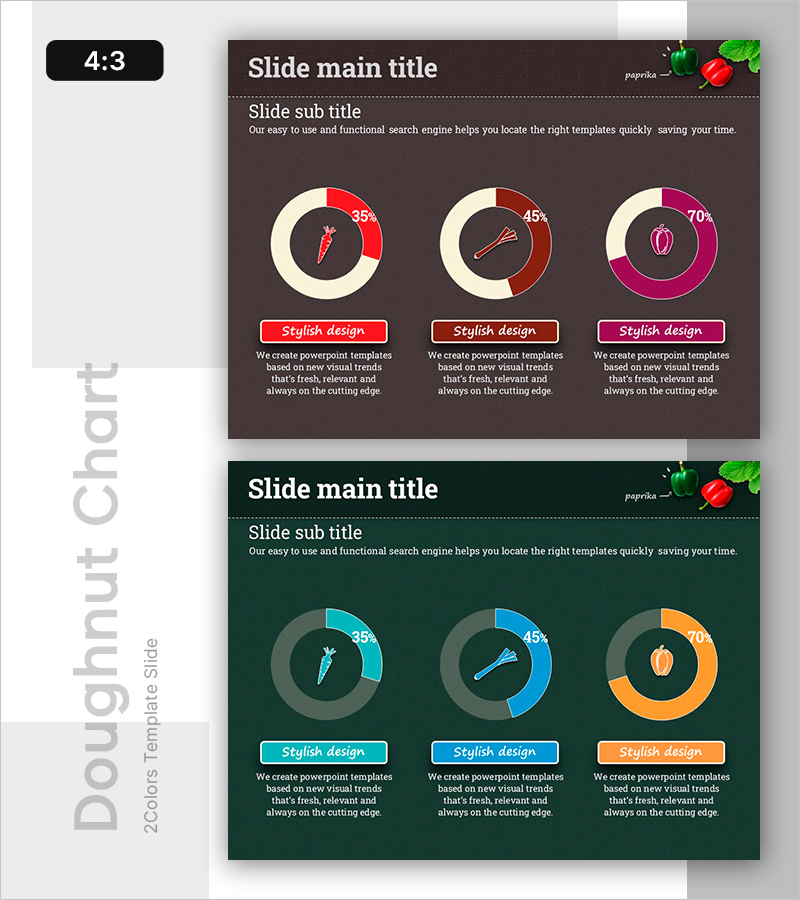
A PowerPoint slide featuring three donut-shaped pie charts for visualizing nutrient ratios by ingredient. The design uses a dark background with cream-colored outer rings and red, brown, and magenta accent segments. Each chart displays percentage values and descriptive text below. Perfect for food science, nutrition, and health presentations to show component composition, sales ratios, and market share. The 4:3 aspect ratio, 2-slide set is ready for immediate editing and customization.
Usage Points
-
Main Usage
Communicate component composition and proportion data in food, nutrition, and health presentations. Donut charts emphasize part-to-whole relationships while the center space allows for icons or additional information, increasing visual information density.
-
How to Use
Replace the donut segments and percentage values with your own data, then edit the descriptive text below each chart. Use in product introductions, nutrition education, health marketing campaigns, dietary analysis presentations, and sales composition reports.
-
Recommended For
Food and nutrition professionals, marketing and product managers, nutritionists and health experts, educators and trainers, students presenting food-related topics. Ideal for anyone explaining ingredient ratios, nutrient content, sales breakdown, or market segmentation in presentations.
-
Slide Structure
2-slide set with three donut charts arranged horizontally on each slide. Each chart features a cream-colored outer ring on dark background, three colored segments (red, brown, magenta), centered icons, percentage labels on the right, and descriptive text at the bottom.
Related Products
-

Blue Orange 3D Donut Graph - Visual Data Analysis
#Product/Service Introduction #Graph #Features
-

App Cable Connection Diagram – Service Structure and Characteristics Design
#Product/Service Introduction #Diagram #Features
-

Comparative Analysis of Composition Contents Pie Chart – Market and Competitor Analysis
#Product/Service Introduction #Market and Competitor Analysis #Graph
-

Digital Service Composition and Characteristics Slide - Informative and Visual Appeal
#Product/Service Introduction #Diagram #Features
