Circular Gradient Wide Template Donut Chart2 – Visualizing Market Analysis and Operational Plans
RJ0200056_10
- Last Update 04/14/2025
- File Size 1.8MB
- # of Slides 2
- File Format PPTX
- Slide Ratio 16:9
- Color
Keywords
- #Content-Based Slides
- #Design-Based Slides
- #Operational Plan
- #Market and Competitor Analysis
- #Graph
- #Production and Technology Development Strategy
- #Market Analysis
- #Circles
- #Doughnut Chart
- #16:9
- #donut chart PowerPoint
- #gradient pie chart slide
- #ratio visualization template
- #3-section donut diagram
- #business analytics slide
- #market analysis presentation
About the Product
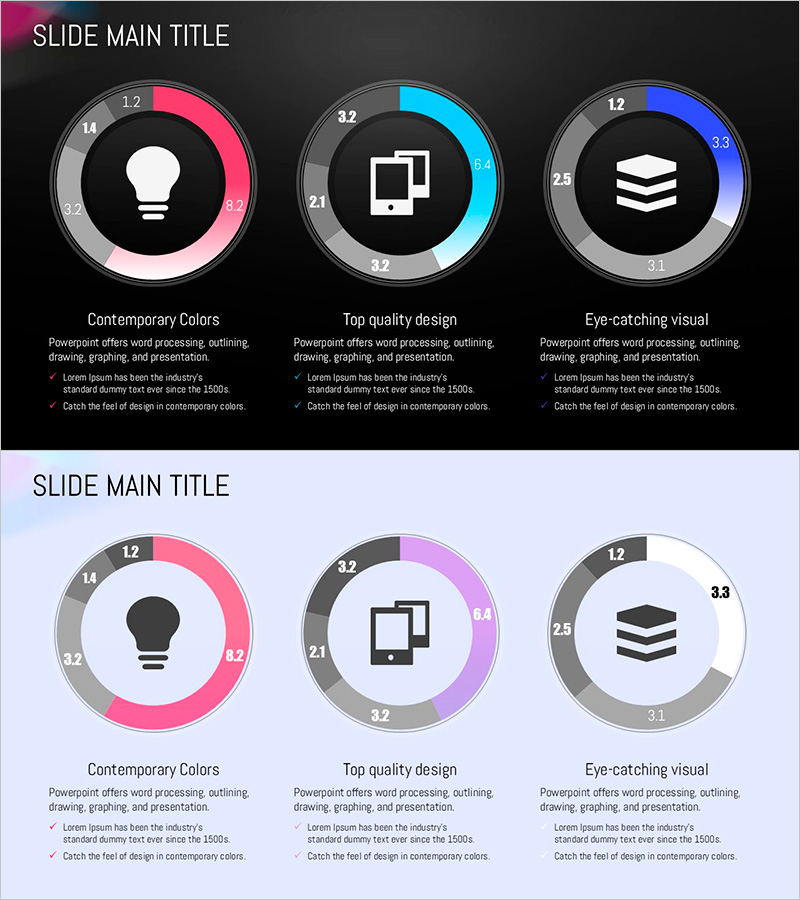
A PowerPoint slide featuring a 3-section donut chart with gradient colors (pink, cyan, blue) for visualizing market analysis and operational planning data. Central icons (lightbulb, device, layers) categorize each section, while numeric labels display precise ratio information. The dark background contrasts with bright gradient segments to maximize presentation impact. Two-slide set includes both dark and light background versions for flexible presentation environments. Fully editable PPTX format ready for immediate use.
Usage Points
-
Main Usage
Compares and emphasizes three-item ratios such as market share, budget distribution, and operational plan composition at a glance. Central icons convey the meaning of each section intuitively, while gradient colors provide visual differentiation and professional appearance.
-
How to Use
Apply in analysis, strategy, and results sections of presentations to visualize quantitative data. Input numerical values for automatic calculation; replace icons and text labels to customize for various business contexts and reporting scenarios.
-
Recommended For
Marketing managers, executives, consultants, and financial analysts presenting business status, market analysis, and budget allocation. Particularly effective for investor presentations, management reports, and strategic briefings.
-
Slide Structure
3-section donut chart × 2 slides. Each section distinguished by gradient color (pink, cyan, blue) with category icons (lightbulb, device, layers) centered. External labels display item names and numerical values. One dark background slide and one light background slide included.
Related Products
-

Plastic Waste Emission PowerPoint Slide – Donut Chart
#Market and Competitor Analysis #Corporate Social Responsibility #Graph
-

Equipment Demand Configuration Graph – Effective Visualization for Market Analysis
#Market and Competitor Analysis #Diagram #Graph
-

Survey and Poll Analysis Graphs – Optimized for Market Analysis
#Market and Competitor Analysis #Diagram #Graph
-

Visual Insights on Education Analysis PowerPoint
#Market and Competitor Analysis #Diagram #Graph
