Work Progress Analysis Graph – Market Share Visualization
RJ0300092_4
- Last Update 05/15/2025
- File Size 1.6MB
- # of Slides 2
- File Format PPTX
- Slide Ratio 16:9
- Color
Keywords
About the Product
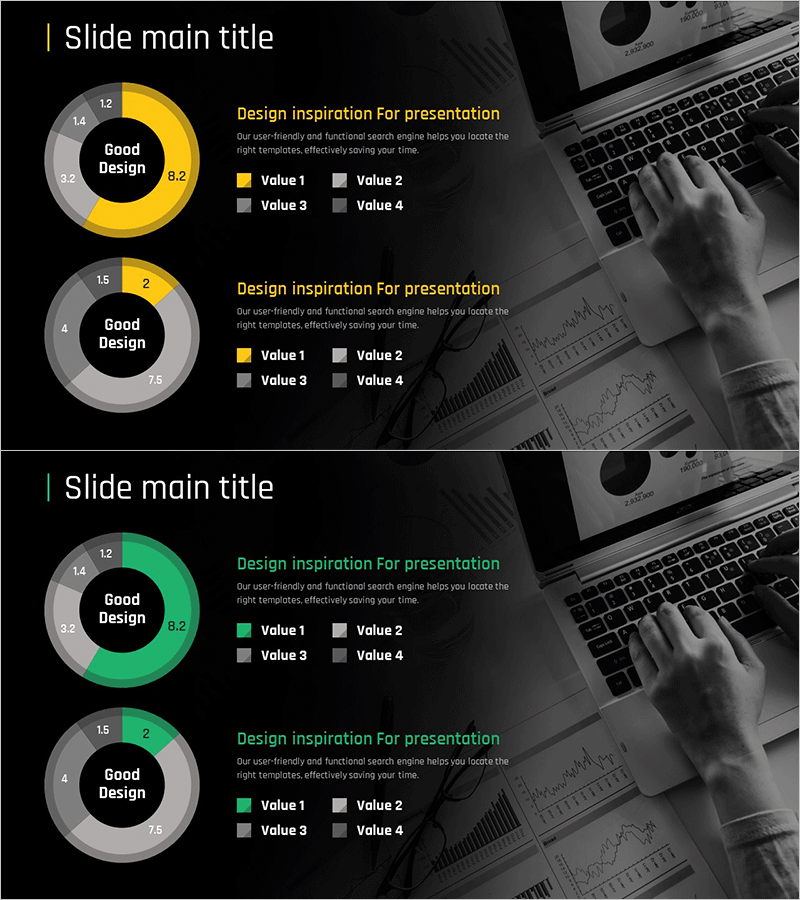
A donut chart PowerPoint slide template designed to visualize work progress and market share data across two slides. The design features yellow and green accent colors for effective data representation, with numerical values positioned in the central circle and detailed items displayed in the outer ring. This presentation template is ready to use in business reports and analytical decks. Provided in 16:9 widescreen PPTX format with two fully customizable chart layouts.
Usage Points
-
Main Usage
Effectively communicate proportional relationships such as market share, sales distribution, budget allocation, and task completion rates. The donut format places key metrics or titles in the central area to draw attention, while color-coded outer rings make each segment's proportion immediately clear to viewers.
-
How to Use
Ideal for executive reports, quarterly performance presentations, marketing analysis documents, and investor pitch decks. Simply replace the sample data and values with your actual figures, adjust the yellow and green colors to match your corporate branding, and insert directly into your presentation slides.
-
Recommended For
Finance professionals, marketing teams, business analysts, and sales managers who present quantitative data regularly. Particularly effective for quarterly results analysis, market research presentations, budget status reports, and project progress updates.
-
Slide Structure
Two-slide layout featuring two donut charts per slide. Each chart consists of a central circle for numerical display and an outer ring divided into four segments with color-coded legend. The dual-tone color scheme (yellow-gray and green-gray) creates clear data hierarchy. Black background with business environment imagery enhances professional appearance.
Related Products
-

Equipment Demand Configuration Graph – Effective Visualization for Market Analysis
#Market and Competitor Analysis #Diagram #Graph
-

Donut Chart Slide for Dessert Menu Research – Market Analysis
#Market and Competitor Analysis #Diagram #Graph
-

World Map and Share Chart for Market Analysis – Effective Data Visualization
#Market and Competitor Analysis #Graph #Other
-

Market Share Global Map – Real-Time Data for Market Analysis
#Market and Competitor Analysis #Graph #Market Share
