Donut Chart Slide for Furniture Preferences Survey
RJ0900032_10
- Last Update 08/25/2025
- File Size 4.4MB
- # of Slides 2
- File Format PPTX
- Slide Ratio 16:9
- Color
Keywords
- #Content-Based Slides
- #Design-Based Slides
- #Market and Competitor Analysis
- #Graph
- #Market Share
- #Market Analysis
- #Circles
- #Doughnut Chart
- #16:9
- #donut chart PowerPoint slide
- #pie chart presentation template
- #market share visualization
- #furniture survey data
- #ratio comparison slide
- #how to create donut chart in PowerPoint
About the Product
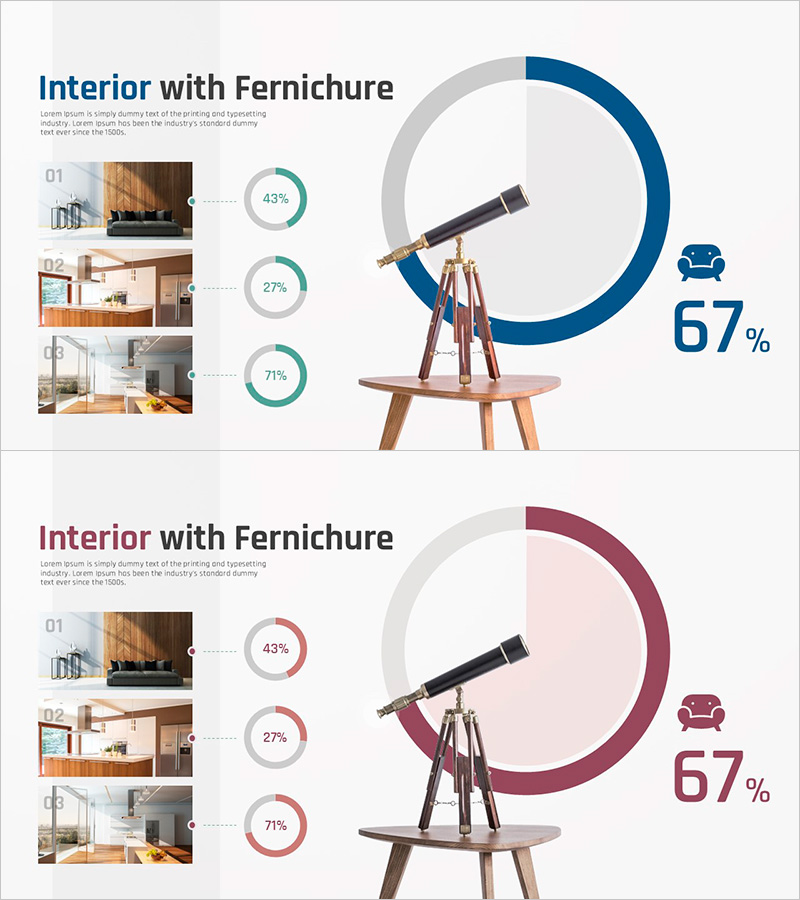
A donut chart PowerPoint slide set designed for furniture preference surveys and market share analysis presentations. This 2-slide collection features donut graphs in navy and terracotta color schemes, each visualizing the distribution of three data categories with clear percentage representation. The slides incorporate a telescope mockup illustration alongside interior design photography, making them ideal for market research and industry analysis presentations. Created in 16:9 widescreen format and fully editable PPTX, these slides enable quick customization of data values and labels for immediate use in business reports.
Usage Points
-
Main Usage
Visualize consumer preference data and market share statistics in furniture industry presentations using donut chart graphics. These slides transform ratio-based data into intuitive visual formats, enhancing audience comprehension during marketing reports, sales presentations, and market analysis briefings.
-
How to Use
Open the slides and replace the chart values and category labels with your survey data. Select either the navy or terracotta color version to match your brand identity, and retain or remove the telescope mockup illustration as needed. The 16:9 aspect ratio ensures optimal display on modern projectors and monitors.
-
Recommended For
Furniture and interior design marketing teams, market research analysts, sales report managers, and consumer preference survey presenters. Ideal for comparing product line sales ratios, customer demographic preferences, regional market penetration, and competitive market positioning across 3-4 data categories.
-
Slide Structure
Two-slide composition featuring a centered donut chart (3-segment division) with large percentage values displayed on the upper right, three interior design reference photos on the left side, and a telescope mockup illustration at the center bottom. Slide 1 uses navy color palette; Slide 2 features terracotta tones for visual variety and brand flexibility.
Related Products
-

Work Progress Analysis Graph – Market Share Visualization
#Market and Competitor Analysis #Graph #Market Share
-

Donut Chart Slide for Dessert Menu Research – Market Analysis
#Market and Competitor Analysis #Diagram #Graph
-

Analyzing ABC District Occupancy with Doughnut Chart
#Market and Competitor Analysis #Graph #Other
-

World Map and Share Chart for Market Analysis – Effective Data Visualization
#Market and Competitor Analysis #Graph #Other
