Analysis of Crime Occurrence Locations – Data Visualization
RJ0800010_6
- Last Update 08/02/2025
- File Size 0.8MB
- # of Slides 2
- File Format PPTX
- Slide Ratio 16:9
- Color
Keywords
About the Product
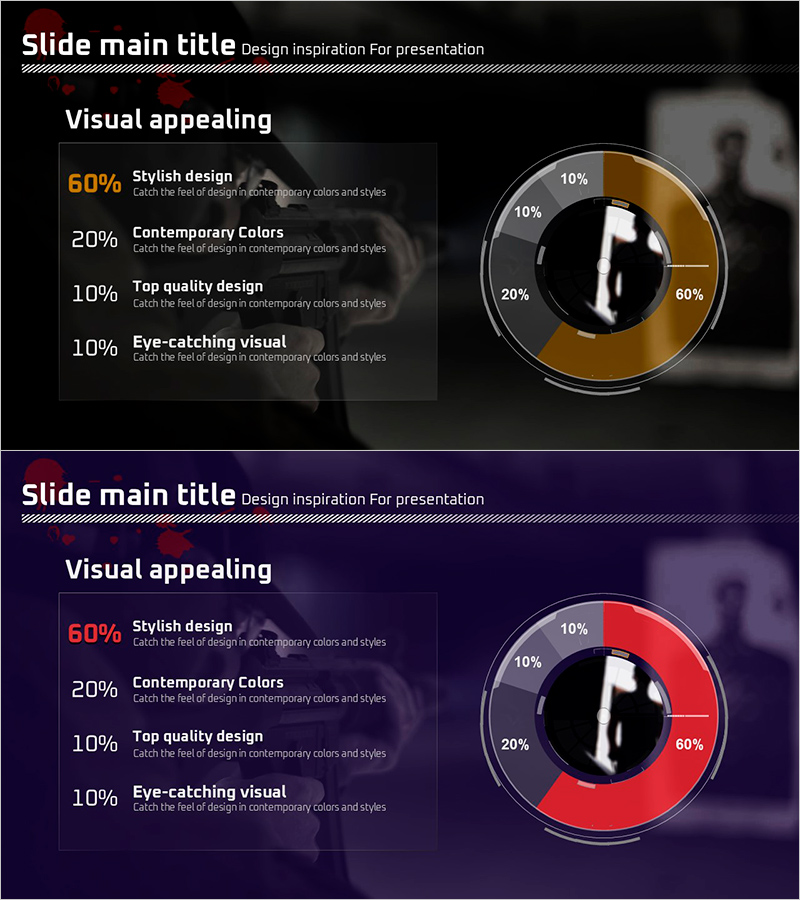
A professional donut chart PowerPoint slide for intuitive data ratio visualization. Featuring a black background with gold and red accent colors across 2 slides, this presentation template combines a left text area with a right-aligned donut graph in a balanced layout. Ideal for crime location analysis, market share, customer satisfaction, and other 4-item ratio data visualization. The 16:9 widescreen PPTX format is fully editable and ready for immediate use in business presentations.
Usage Points
-
Main Usage
Visualize 4-item ratio data using donut charts to enhance audience comprehension. Effective for crime location analysis, market share distribution, customer satisfaction metrics, and sales composition. The high-contrast black background design ensures clarity in projector environments and maintains readability across all viewing distances.
-
How to Use
Enter item names and descriptions in the left text area, then edit the donut chart values to match your actual data. Color differentiation clearly distinguishes each segment, while percentage labels convey ratio relationships intuitively. Reuse the 2-slide template to present multiple datasets sequentially throughout your presentation.
-
Recommended For
Recommended for data analysis reports, market research presentations, executive briefings, academic seminars, and sales performance reviews. Ideal for finance, insurance, retail, government agencies, and research institutions requiring quantitative data-driven decision presentations.
-
Slide Structure
2-slide layout with each slide featuring a left text box (for item names and descriptions) and a right-aligned donut chart (4 segments showing 60%, 20%, 10%, 10% ratios). Slide 1 uses gold accents while Slide 2 uses red accents, enabling distinct dataset representation.
Related Products
-

Travel Destination Infographic Market Share – Intuitive Data Visualization
#Market and Competitor Analysis #Graph #Market Share
-

Donut Chart Comparing Market Share by Coffee Brand
#Market and Competitor Analysis #Diagram #Graph
-

Equipment Demand Configuration Graph – Effective Visualization for Market Analysis
#Market and Competitor Analysis #Diagram #Graph
-

Donut Chart Slide for Dessert Menu Research – Market Analysis
#Market and Competitor Analysis #Diagram #Graph
