Visualizing Social Network Analysis with Horizontal Bar Chart – Marketing Strategy
RJ0200055_6
- Last Update 04/14/2025
- File Size 0.2MB
- # of Slides 2
- File Format PPTX
- Slide Ratio 16:9
- Color
Keywords
- #Content-Based Slides
- #Design-Based Slides
- #Marketing Plan and Strategy
- #Graph
- #Distribution Strategy
- #Horizontal Bar
- #Segmented Horizontal Bar
- #16:9
- #horizontal bar chart PowerPoint
- #year-over-year comparison slide
- #gradient chart template
- #marketing data visualization
- #PowerPoint graph slide design
About the Product
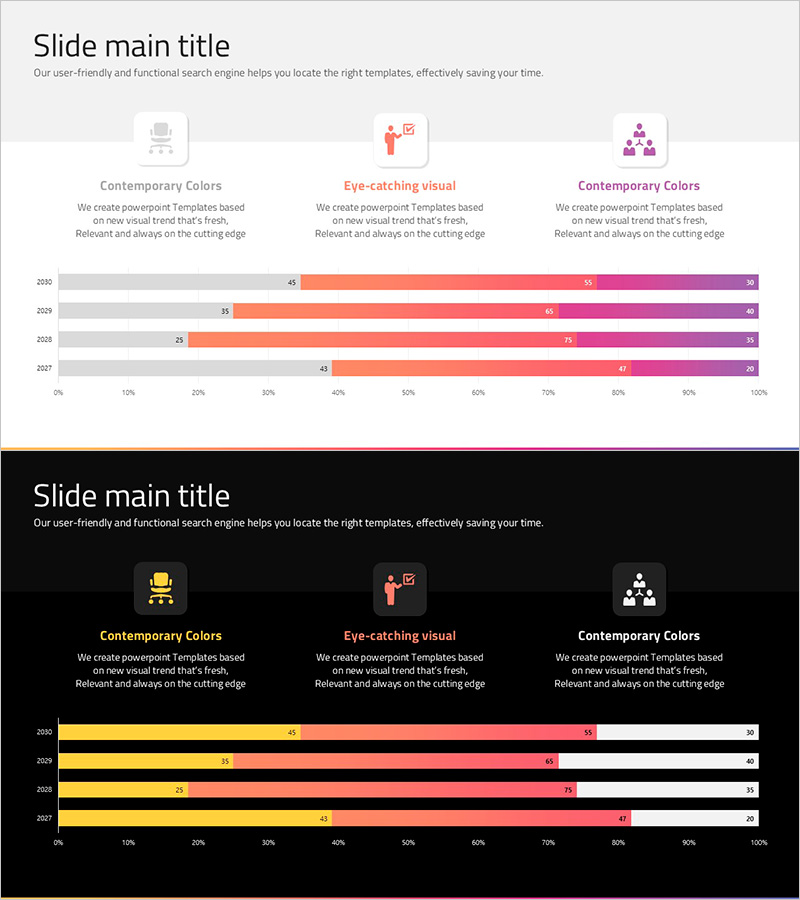
A horizontal bar chart PowerPoint slide comparing data across four years from 2027 to 2030. The design features a gradient color scheme transitioning from orange to pink and purple, emphasizing visual flow and temporal progression. Three data series per year are arranged horizontally for intuitive item-to-item comparison. This slide template is ready to use for marketing strategy presentations, business performance reports, social network analysis, and annual trend analysis in professional presentations.
Usage Points
-
Main Usage
Designed to display numerical comparisons across years and categories in a horizontal layout, making size differences between data points immediately apparent. The gradient color transition visually reinforces temporal progression, making it ideal for expressing business metrics such as marketing performance, sales trends, and customer analytics.
-
How to Use
Open the slide and double-click each year and data series to input your numbers directly; the chart updates automatically. Colors, bar thickness, and fonts are fully editable to match your brand guidelines. Additional years or data series can be added by duplicating and modifying existing chart elements.
-
Recommended For
Marketing teams presenting campaign performance reports, sales teams delivering quarterly results, executives briefing on business status, investors explaining growth trajectories, and consulting firms presenting client analysis and market research findings.
-
Slide Structure
Two-slide layout. Slide 1 features a light background with four horizontal bar charts (2027–2030) displaying three data series each. Slide 2 uses a dark background with the same chart structure rendered in yellow, orange, and pink tones, providing flexibility for different presentation environments.
Related Products
-

Horizontal Bar Charts for Customer Analysis – Summer Vacation Template
#Market and Competitor Analysis #Graph #Other
-

Effective Slide for Visualizing Business Progress with Segmentation Chart
#Business Introduction #Business Strategy #Graph
-

Variation Segmentation Graph for Reading Volume – Market Trend Insights
#Market and Competitor Analysis #Graph #Industry Trends
-

Skill Graph for Performance Visualization – Vision and Growth
#Company Introduction #Product/Service Introduction #Graph
