Turquoise Green Comparative Graph – Market Analysis and Trends
RJ0500027_19
- Last Update 06/14/2025
- File Size 0.9MB
- # of Slides 2
- File Format PPTX
- Slide Ratio 16:9
- Color
Keywords
About the Product
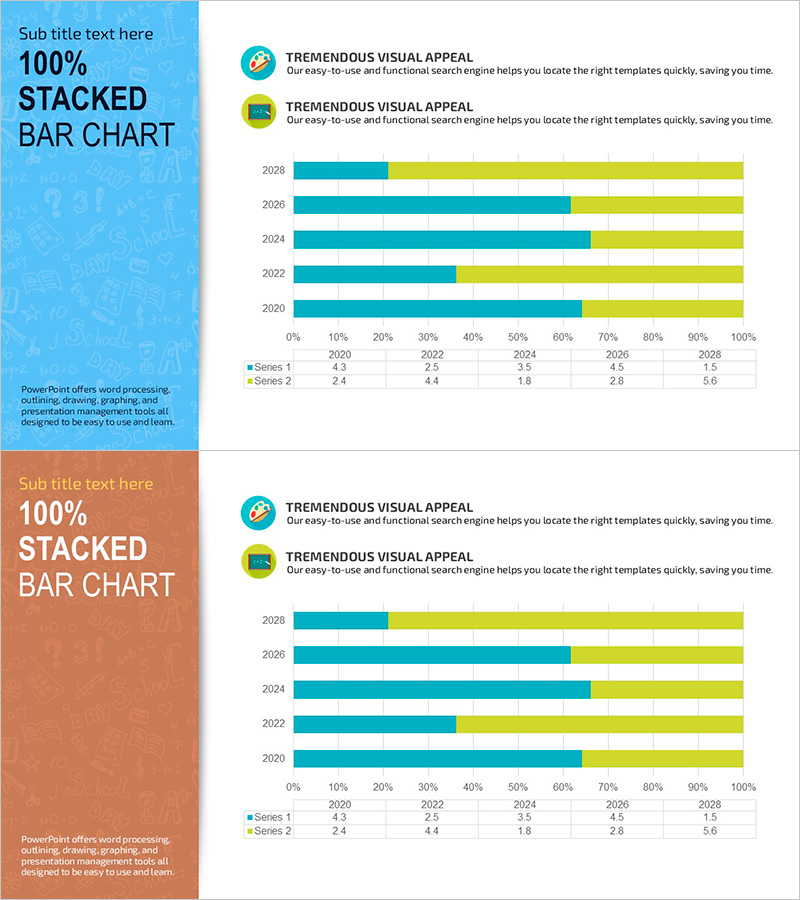
A 100% stacked horizontal bar chart PowerPoint slide optimized for market analysis and trend comparison. This presentation template features turquoise and green data series visualizing year-over-year ratio changes from 2028 to 2020. Each year displays the proportional breakdown of Series 1 and Series 2, with exact numerical values provided in a reference table below the chart. The slide design is ready for immediate use in business reports, marketing presentations, and market research documents.
Usage Points
-
Main Usage
Displays year-over-year data proportions in 100% stacked format, allowing simultaneous comparison of series composition and overall trends. Ideal for visualizing market share, sales composition, customer distribution, and other ratio-based comparative analysis.
-
How to Use
Replace the data values in the reference table with your own figures, and the chart automatically updates. Customize the turquoise and green colors to match your corporate branding, and adjust years or category labels as needed for your specific data range.
-
Recommended For
Marketing professionals, business analysts, and strategists presenting market trends, sales performance, and customer segmentation data. Suitable for quarterly business reports, strategic planning documents, market analysis presentations, and performance reviews.
-
Slide Structure
Two-slide set, each featuring a 100% stacked horizontal bar chart with turquoise (Series 1) and green (Series 2) data series. Displays five years of data (2028, 2026, 2024, 2022, 2020) on a 0–100% scale, with a reference table below showing precise numerical values for each series.
Related Products
-

Navy-Orange 100% Stacked Chart
#Market and Competitor Analysis #Graph #Industry Trends
-

Yellow Green Detailed Analysis Chart - Visualizing Market Trends
#Business Strategy #Market and Competitor Analysis #Diagram
-

Bar Chart for Eco-friendly Practices Trends Visualization
#Market and Competitor Analysis #Graph #Industry Trends
-

Plant Horizontal Bar Chart – Understand Market Trends
#Market and Competitor Analysis #Graph #Market Analysis
