Red Green Detail Analysis Chart – Visualizing Market Share
RJ0500029_7
- Last Update 06/15/2025
- File Size 0.3MB
- # of Slides 2
- File Format PPTX
- Slide Ratio 16:9
- Color
Keywords
- #Content-Based Slides
- #Design-Based Slides
- #Market and Competitor Analysis
- #Graph
- #Market Status
- #Market Share
- #Horizontal Bar
- #Circles
- #Segmented Horizontal Bar
- #Pie Chart
- #16:9
- #pie chart PowerPoint slide
- #horizontal bar graph template
- #market share visualization
- #business data chart
- #year-over-year trend analysis
- #presentation slide download
About the Product
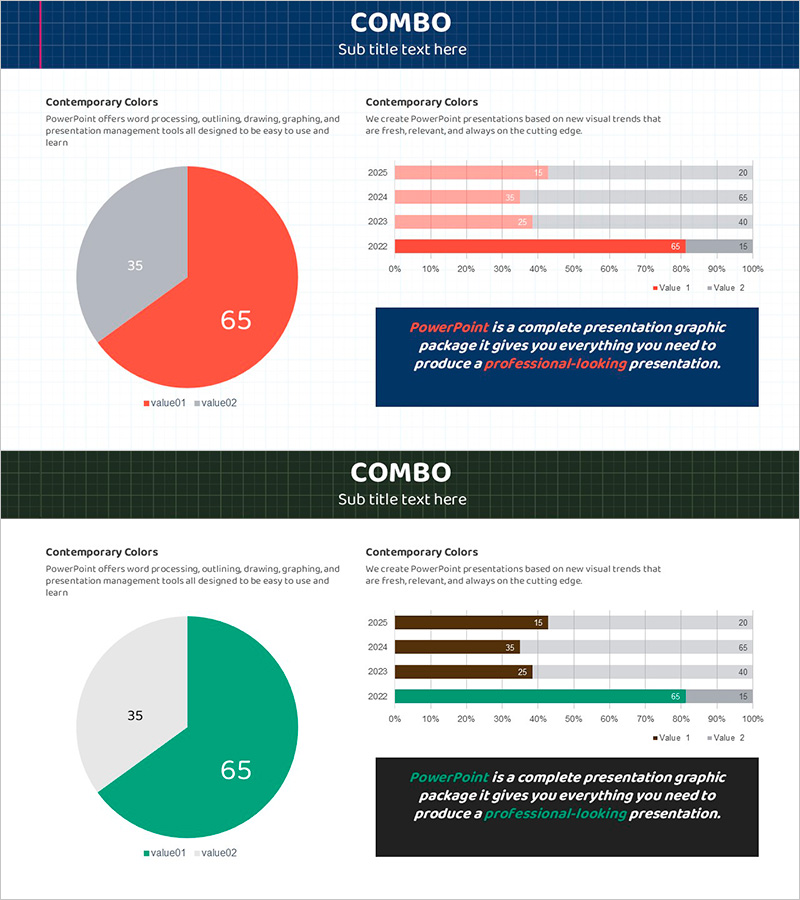
A dual-chart PowerPoint slide combining pie chart and horizontal bar graph to visualize market share and year-over-year trends simultaneously. The red and green two-tone color scheme creates clear contrast between datasets, making it ideal for business analysis, executive reports, and marketing presentations. This 2-slide set features a pie chart (65% vs 35% ratio) and a horizontal bar chart (4-year trend from 2025 to 2022 with 2 data series) in 16:9 widescreen PPTX format. All elements—colors, values, and labels—are fully editable, allowing seamless customization for diverse business datasets and reporting scenarios.
Usage Points
-
Main Usage
Simultaneously compare current market share distribution and historical performance trends. The pie chart displays proportional breakdown while the horizontal bar chart reveals year-over-year changes, enabling stakeholders to understand both snapshot and trajectory. Perfect for demonstrating competitive positioning and growth patterns to executives, investors, and clients.
-
How to Use
Deploy in quarterly business reviews, investor pitch decks, competitive analysis meetings, and marketing strategy sessions. Use the pie chart to show current market composition and the bar chart to illustrate 4-year performance evolution. Ideal for any presentation requiring quantitative evidence of market dynamics and historical context.
-
Recommended For
C-suite executives, CFOs, marketing directors, sales leaders, business analysts, consultants, and strategic planners. Essential for professionals who need to support decisions with data-driven market insights. Applicable across manufacturing, retail, finance, technology, and service industries for competitive analysis and performance reporting.
-
Slide Structure
Slide 1: Pie chart (2-segment, 65% red / 35% green) with legend and descriptive text. Slide 2: Horizontal bar chart (4-year span 2025–2022, 2 data series in red and green) with legend and text area. All chart elements, values, and labels are fully customizable within 16:9 widescreen format.
Related Products
-

Mint & Orange Pie Chart Analysis - Market Status and Share
#Market and Competitor Analysis #Graph #Market Status
-

Pie Chart Composition Ratio Analysis – Market Status and Competitive Insights
#Market and Competitor Analysis #Graph #Market Status
-

Pie Chart for Workout Type Preferences – Market Status
#Market and Competitor Analysis #Diagram #Graph
-

Graph Ratio by Subject – Education Market Analysis
#Market and Competitor Analysis #Graph #Market Share
