Social Network Wide Template Table – Financial Planning and Results
RJ0200055_5
- Last Update 04/14/2025
- File Size 0.2MB
- # of Slides 2
- File Format PPTX
- Slide Ratio 16:9
- Color
Keywords
- #Content-Based Slides
- #Design-Based Slides
- #Financial Plans and Performance
- #Diagram
- #Capital Requirements
- #Key Financial Indicators
- #Table
- #Standard Table
- #16:9
- #table PowerPoint slide
- #horizontal table template
- #financial planning chart
- #performance comparison table
- #data visualization slide
- #6-column table PowerPoint
About the Product
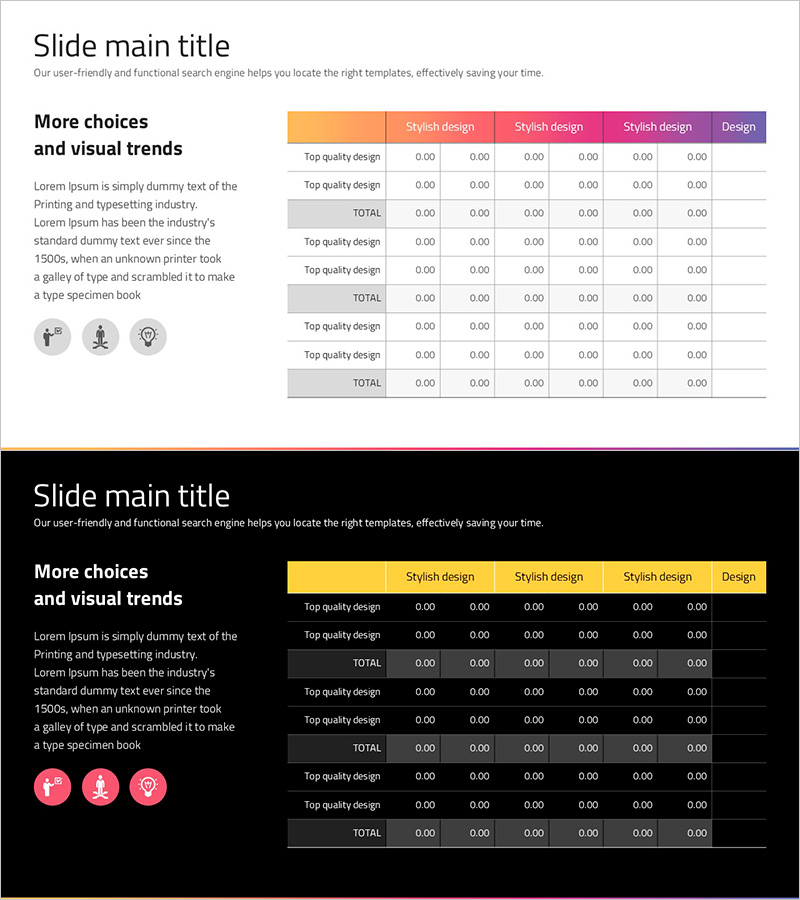
A 6-column horizontal table PowerPoint slide designed for comparing financial planning and performance metrics. Features an orange-to-pink-to-purple gradient header row and gray divider rows that enhance data readability. Each column includes 'Top quality design' labels and numeric input fields for presenting financial indicators, performance metrics, and budget-versus-actual comparisons. The 2-slide set allows you to present multiple data sets sequentially, while the 16:9 widescreen format ensures compatibility with modern presentation environments. Fully editable PPTX format for immediate customization.
Usage Points
-
Main Usage
Visualize financial planning, budgets, and performance metrics in a structured table format to improve audience comprehension. Enables quick comparison of quarterly or annual data, goal-versus-actual results, and departmental performance across multiple dimensions.
-
How to Use
Enter financial figures, performance indicators, and budget items into each cell. Customize header colors and row backgrounds to emphasize key metrics. Use both slides to present multiple data sets in sequence or side-by-side comparisons.
-
Recommended For
Finance professionals, executives, and investor presentations; quarterly performance reports; budget planning meetings; financial analysis reports; and the financial section of business plans.
-
Slide Structure
Organized as a 6-column × multi-row layout with an orange-pink-purple gradient header row and gray TOTAL rows that clearly separate data sections. Each row contains 'Top quality design' labels and six numeric input fields, optimized for comparative financial analysis.
Related Products
-

Painting Template Table – Visualizing Financial Plans
#Financial Plans and Performance #Diagram #Capital Requirements
-

Diagram for Visualizing Financial Plans – Grey Brown Design
#Financial Plans and Performance #Diagram #Capital Requirements
-

Trend Color Wide Template Table – Emphasizing Financial Planning and Performance
#Financial Plans and Performance #Diagram #Capital Requirements
-

Hotpot Table Chart – Clearly Present Financial Performance
#Financial Plans and Performance #Diagram #Capital Requirements
