Social Network Strategy Visualization Table Slide
RJ0200055_25
- Last Update 04/14/2025
- File Size 0.2MB
- # of Slides 2
- File Format PPTX
- Slide Ratio 16:9
- Color
Keywords
- #Content-Based Slides
- #Design-Based Slides
- #Business Strategy
- #Financial Plans and Performance
- #Diagram
- #Sales and Revenue
- #Table
- #Standard Table
- #Project Progress
- #16:9
- #table diagram PowerPoint
- #data comparison slide template
- #business strategy table
- #financial planning visualization PPT
- #comparison table slide design
About the Product
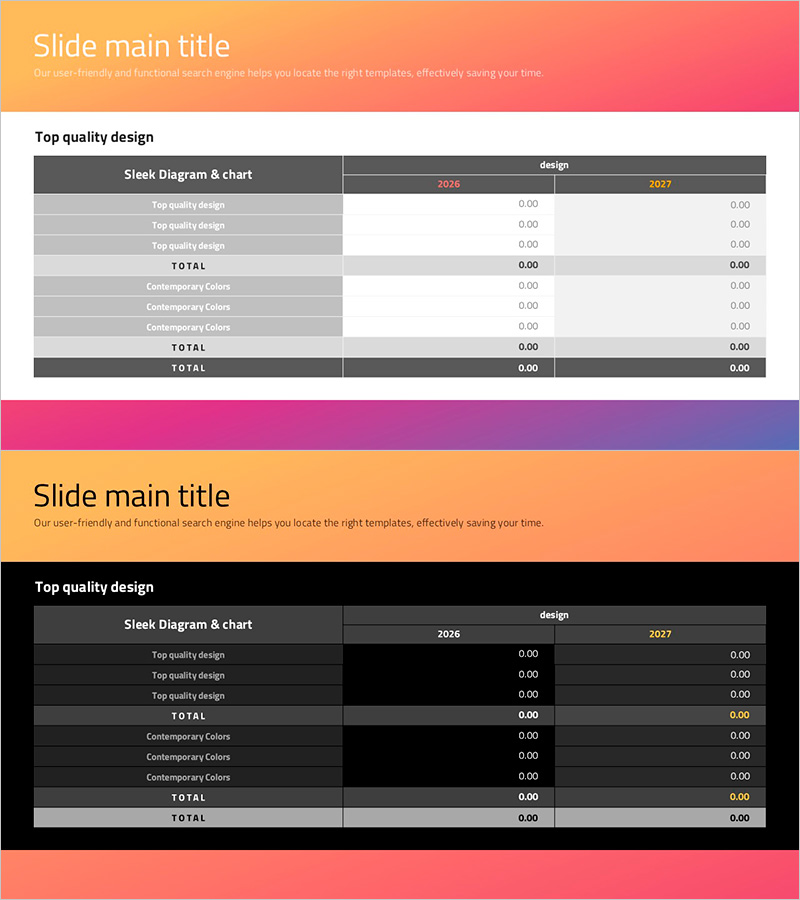
A table-format diagram PowerPoint slide for visualizing business strategy and financial planning data. The 2-row 3-column structure enables clear year-over-year and item-by-item data comparison. The header features an orange-pink-purple gradient banner, while gray row separators emphasize information hierarchy. The upper gradient banner unifies the visual presentation across slides, and cells accept direct text and numeric input for immediate use. This 16:9 widescreen 2-slide set applies to business status reports, financial performance analysis, and strategic comparisons.
Usage Points
-
Main Usage
Visualizes structured data in table format for business progress reports, financial performance, and strategic comparisons. Enables year-over-year and item-by-item numeric comparison while supporting direct cell editing for immediate data input.
-
How to Use
Use in business status reports, financial analysis presentations, and strategy planning meetings to organize quarterly/annual comparisons, budget-vs-actual analysis, and KPI tracking by strategy. The header color and row separators automatically guide audience attention through information hierarchy.
-
Recommended For
Ideal for CFOs, finance teams, business planning departments, and executive reporting. Particularly suited for quantitative data-driven presentations including quarterly/annual performance comparison, budget variance analysis, and strategy-specific KPI tracking.
-
Slide Structure
2-row 3-column table with left row headers (category names), top column headers (years/periods), and intersection cells (numeric/text data). Headers use orange-pink-purple gradient; data rows alternate between light and dark gray for enhanced readability.
Related Products
-

Presentation Template Visualizing Business Strategy with Horizontal Bar Graph
#Business Strategy #Financial Plans and Performance #Diagram
-

Visualizing Business Strategies with Tables & Charts – Clear Data Presentation
#Business Strategy #Financial Plans and Performance #Diagram
-

Sales and Profit Chart by Year – Effective Financial Analysis
#Market and Competitor Analysis #Financial Plans and Performance #Diagram
-

Infinite Energy Wide PPT Table Analysis – Core of Financial Planning
#Financial Plans and Performance #Diagram #Capital Requirements
