Financial Planning and Scorecard Blue Orange
RJ0600004_17
- Last Update 06/22/2025
- File Size 3MB
- # of Slides 2
- File Format PPTX
- Slide Ratio 16:9
- Color
Keywords
- #Content-Based Slides
- #Design-Based Slides
- #Financial Plans and Performance
- #Diagram
- #Projected Return on Investment (ROI)
- #Sales and Revenue
- #Table
- #Standard Table
- #16:9
- #financial planning table PowerPoint
- #scorecard slide template
- #data comparison table
- #financial metrics PPT
- #ROI table slide
- #performance scorecard template
About the Product
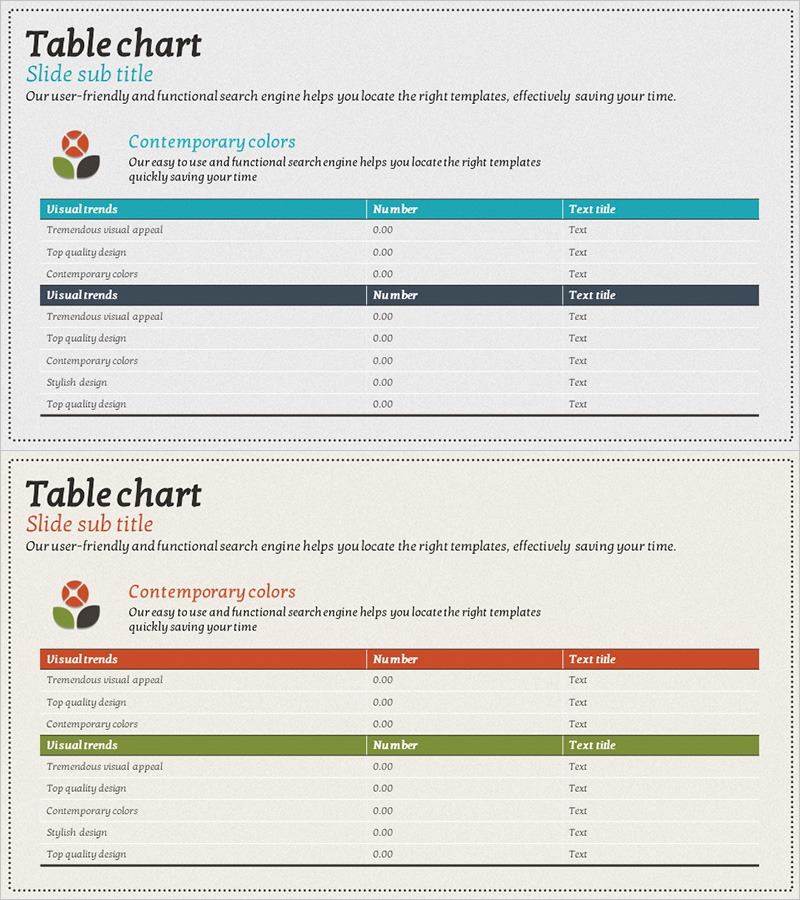
A table-based PowerPoint slide for comparing financial status and performance metrics at a glance. Featuring teal and orange headers that distinguish two table structures, this slide enables you to organize key indicators such as financial planning, return on investment, and revenue. Each table comprises three columns (item name, number, description) with rows that can be easily added or modified. Optimized for 16:9 widescreen format with 2 slides, this presentation template effectively communicates quantitative information in financial reports, business performance presentations, and investor briefings.
Usage Points
-
Main Usage
Organize and compare quantitative data such as financial status, performance metrics, return on investment, and revenue in table format. The teal and orange headers visually distinguish two data sets, clearly communicating financial performance.
-
How to Use
Use in financial reports, quarterly performance presentations, investor briefings, and business planning presentations to present key financial metrics in table format. Enter item names, figures, and descriptions in each row to systematically organize financial status.
-
Recommended For
CFOs, finance managers, executives, investor relations specialists, and business planners who need to explain financial performance and metrics quantitatively. Particularly suitable for quarterly earnings presentations, annual financial reports, and investor pitch meetings where credible data representation is essential.
-
Slide Structure
2-slide composition. First slide features a teal-header table (3 columns: item name, number, description) displaying 5 rows of financial planning data. Second slide shows two tables with teal and green headers (each 3 columns, 5 rows) comparing performance metrics. All tables use editable cell structures for easy data addition and modification.
Related Products
-

Toy Image and Table – Emphasizing Financial Planning
#Financial Plans and Performance #Diagram #Projected Return on Investment (ROI)
-

Summer Vacation Template Table – Visualizing Financial Performance
#Financial Plans and Performance #Diagram #Projected Return on Investment (ROI)
-

Color-highlighted Bar Graphs and Tables – Optimized for Financial Analysis
#Financial Plans and Performance #Diagram #Graph
-

Simple Circle Presentation Template Doughnut Chart – Visualizing Financial Performance
#Financial Plans and Performance #Diagram #Graph
