Hologram Wide Bar Chart for Business Status Visualization – Innovation and Achievement
RJ0200053_8
- Last Update 04/14/2025
- File Size 1.3MB
- # of Slides 2
- File Format PPTX
- Slide Ratio 16:9
- Color
Keywords
About the Product
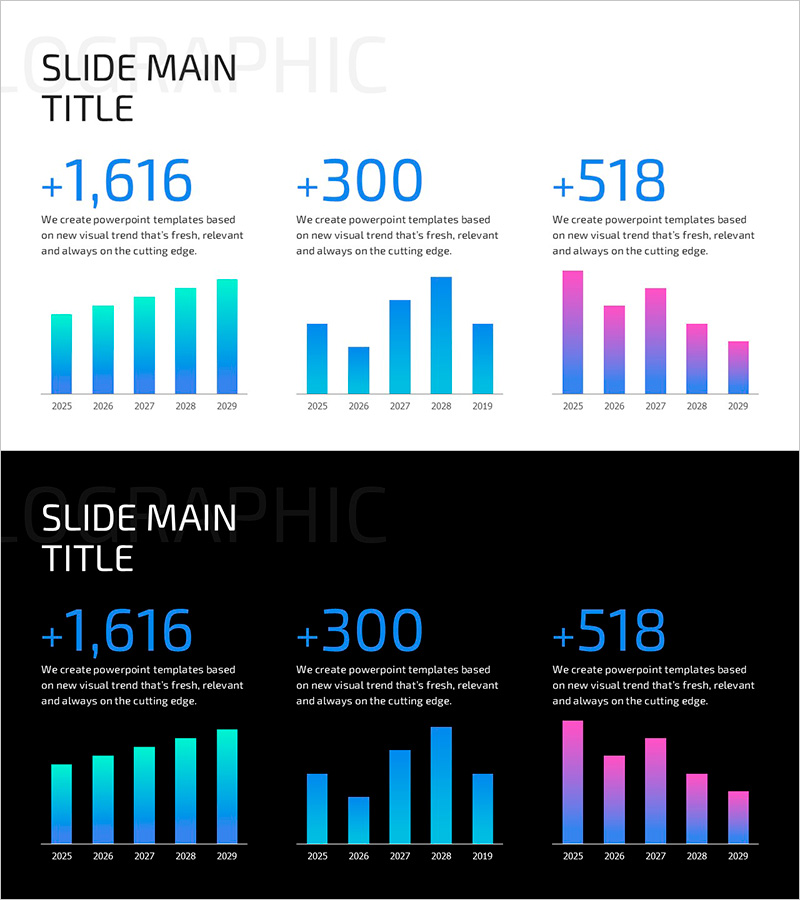
A professional horizontal bar chart slide with hologram-style gradient effects for visualizing business performance across multiple metrics. This PowerPoint slide features three data series in blue, cyan, and magenta gradients, displaying year-over-year trends from 2025 to 2029. Each bar represents a distinct metric, enabling quick comparison of growth rates and performance indicators. The 2-slide set includes both light and dark background versions, making it adaptable to any presentation environment. Ideal for executive reports, investor presentations, and strategic business reviews where multi-series data comparison is essential.
Usage Points
-
Main Usage
Compare three or more data series simultaneously—such as annual revenue, departmental performance, or key business indicators. The hologram gradient effect enhances data credibility and visual impact, making it ideal for C-suite presentations, investor briefings, and strategic planning sessions where multi-metric analysis is critical.
-
How to Use
Input your actual data values into the five year intervals and three data series fields. Bar lengths adjust automatically based on values entered. Customize colors and background (light or dark) to match your corporate branding or presentation theme. Duplicate and extend bars if additional years or metrics are needed.
-
Recommended For
CFOs, business analysts, marketing directors, and operations managers presenting quarterly or annual performance reviews. Best suited for organizations tracking three or more key performance indicators simultaneously—such as revenue, profit margin, and customer acquisition—in corporate board meetings, investor relations events, and strategic planning workshops.
-
Slide Structure
Two-slide layout with identical structure: title area, one horizontal bar chart with three gradient-colored series, and five year-based legend markers. First slide features light background with blue, cyan, and magenta bars; second slide uses dark background with matching color gradients for flexible presentation context.
Related Products
-

Green & Gray Template Wide Vertical Bar Chart – Performance Visualization
#Company Introduction #Business Strategy #Graph
-

Business Forest Wide Template Column Chart
#Company Introduction #Graph #Company Overview
-

Origami Presentation Template Map – Visualize Market Analysis
#Market and Competitor Analysis #Graph #Other
-

Structure Presentation Template Column Chart – Essential Tool for Market and Competitor Analysis
#Market and Competitor Analysis #Graph #Competitor Analysis
