Car Wide Template Vertical Bar Graph – Market Analysis and Competitive Advantage
RJ0200044_15
- Last Update 04/10/2025
- File Size 6.1MB
- # of Slides 2
- File Format PPTX
- Slide Ratio 16:9
- Color
Keywords
- #Content-Based Slides
- #Design-Based Slides
- #Market and Competitor Analysis
- #Financial Plans and Performance
- #Graph
- #Competitive Advantage
- #Sales and Revenue
- #Column
- #Column Chart
- #16:9
- #vertical bar chart PowerPoint
- #automotive market analysis slides
- #data visualization template
- #competitive advantage chart
- #sales comparison graph
About the Product
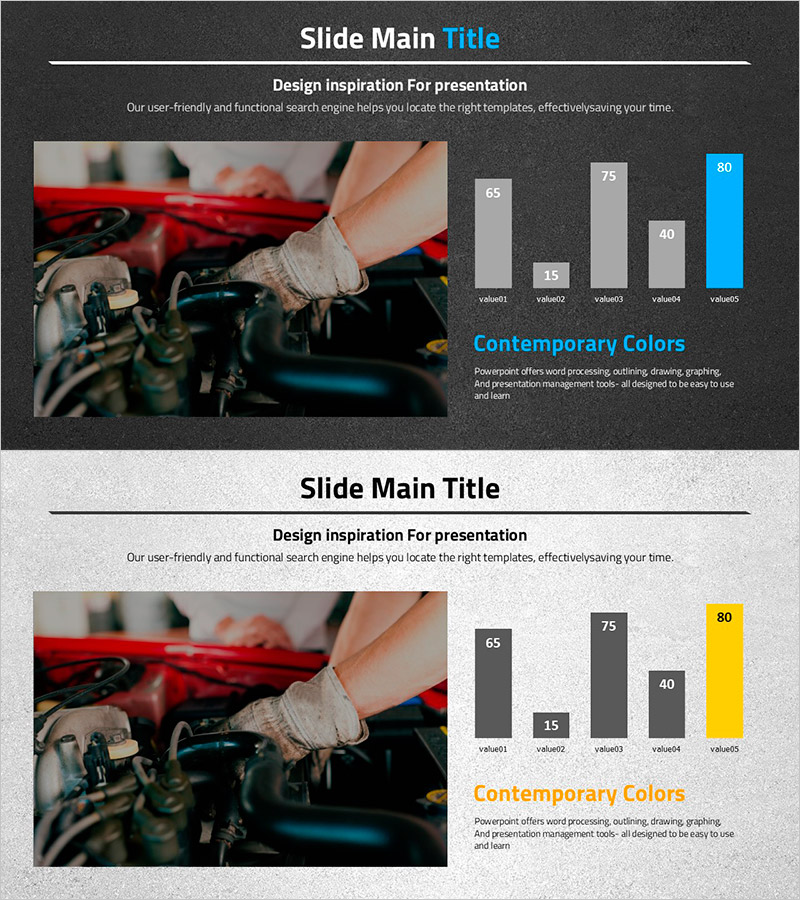
A vertical bar chart PowerPoint slide designed for automotive industry market analysis and competitive advantage comparison. The dark background features cyan, gray, and yellow accent colors to clearly represent five data items. The 16:9 widescreen format with 2-slide composition is optimized for presenting quantitative information such as sales comparison, competitor analysis, and market share. This presentation template is ready to use in reports and business presentations.
Usage Points
-
Main Usage
This slide compares quantitative data across five items such as market size, competitor sales, market share, and sales volume in the automotive industry. The bar heights intuitively express numerical differences, making it effective for executive reports and investor presentations.
-
How to Use
Use in market analysis sections, competitive advantage analysis, and financial performance reports. Replace the numerical labels above each bar with your own data and modify item names as needed for immediate presentation use.
-
Recommended For
Automotive manufacturers and suppliers, automotive industry analysts, marketing and sales professionals, executive report managers, and investor relations specialists who need to convey market conditions and competitiveness persuasively.
-
Slide Structure
2-slide composition featuring a vertical bar chart with 5 items (value01–value05) on the first slide and a 'Contemporary Colors' title with descriptive text area on the second. The dark background with cyan accent color and gray/yellow data bars creates maximum contrast effect.
Related Products
-

Ranking of Popularity Vote on the Menu – Visualized with Horizontal Bar Chart
#Market and Competitor Analysis #Financial Plans and Performance #Graph
-

Highlighted Vertical Bar Graph (Green & Orange) – Clear Visualization for Data Comparison
#Market and Competitor Analysis #Financial Plans and Performance #Graph
-

India Travel Vertical Bar Graph – Visual Appeal of Green and Red
#Market and Competitor Analysis #Financial Plans and Performance #Graph
-

Typographic Wide Template Bar Chart & Table – Competitive Analysis and Performance
#Market and Competitor Analysis #Financial Plans and Performance #Diagram
