Typographic Wide Template Bar Chart & Table – Competitive Analysis and Performance
RJ0200047_6
- Last Update 04/11/2025
- File Size 0.2MB
- # of Slides 2
- File Format PPTX
- Slide Ratio 16:9
- Color
Keywords
- #Content-Based Slides
- #Design-Based Slides
- #Market and Competitor Analysis
- #Financial Plans and Performance
- #Diagram
- #Graph
- #Competitive Advantage
- #Sales and Revenue
- #Table
- #Column
- #Standard Table
- #Column Chart
- #16:9
- #horizontal bar chart PowerPoint
- #competitive analysis presentation
- #data comparison slides
- #performance analysis PPT template
- #table chart slide template
About the Product
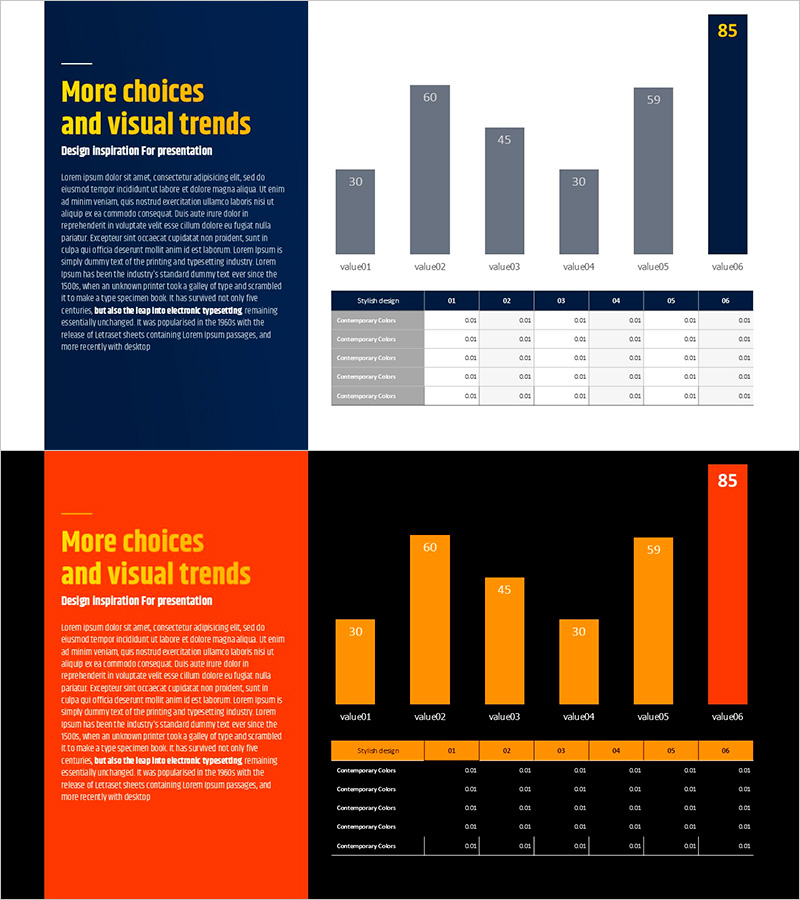
A 2-slide PowerPoint presentation designed for competitive analysis and performance comparison. The first slide features a horizontal bar chart with 6 data items, enabling quick visual comparison of metrics. The second slide presents a structured data table for detailed numerical breakdown. Set against a dark blue background with gray and yellow accent bars and text boxes, the design ensures clear data readability. Formatted in 16:9 widescreen ratio, this presentation template is optimized for modern business environments and ready to use in marketing plans, business reports, and market analysis decks.
Usage Points
-
Main Usage
Visualize multi-item numerical data such as competitor performance comparison, market share analysis, and departmental results using horizontal bar charts, while organizing detailed figures in a structured table for informed decision-making.
-
How to Use
Replace bar values and labels on the first slide with your actual data, then modify the table rows and columns on the second slide to match your analysis scope. Colors are fully editable to align with corporate branding guidelines.
-
Recommended For
Marketing professionals presenting competitive analysis, sales teams reporting market conditions, executive-level performance reviews, consulting firms conducting benchmarking studies, and academic presentations requiring comparative analysis sections.
-
Slide Structure
Slide 1: Horizontal bar chart with 6 data items (value01–value06, max value 85), includes legend and data labels. Slide 2: Data table with 5 rows and 6 columns (rows: style type and 4 contemporary color categories, columns: 01–06 data series), header row highlighted.
Related Products
-

Ranking of Popularity Vote on the Menu – Visualized with Horizontal Bar Chart
#Market and Competitor Analysis #Financial Plans and Performance #Graph
-

Modern Wide PowerPoint Template Bar chart&Table
#Business Introduction #Financial Plans and Performance #Diagram
-

Orange Hexagon Presentation Template Vertical Bar Graph
#Market and Competitor Analysis #Financial Plans and Performance #Graph
-

Highlighted Vertical Bar Graph (Green & Orange) – Clear Visualization for Data Comparison
#Market and Competitor Analysis #Financial Plans and Performance #Graph
