Hologram Wide PPT Streamlined Graph
RJ0200053_25
- Last Update 04/13/2025
- File Size 0.6MB
- # of Slides 2
- File Format PPTX
- Slide Ratio 16:9
- Color
Keywords
- #Content-Based Slides
- #Design-Based Slides
- #Market and Competitor Analysis
- #Graph
- #Future Outlook
- #Competitive Advantage
- #Horizontal Bar
- #Segmented Horizontal Bar
- #16:9
- #horizontal bar chart PowerPoint
- #bar graph slide template
- #data visualization PPT
- #market analysis chart
- #competitive comparison graph
- #revenue growth chart
About the Product
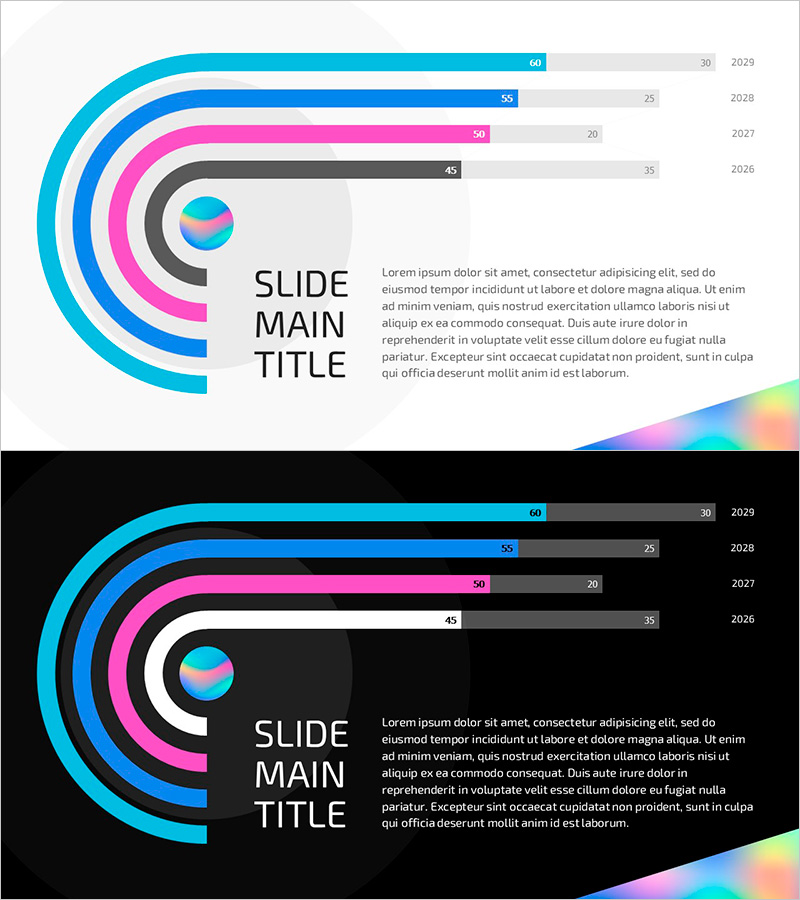
A horizontal bar chart PowerPoint slide visualizing year-over-year data across four categories. Features hologram-style gradient bars in cyan, blue, magenta, and gray tones, perfect for displaying revenue growth, market share, competitive benchmarking, and performance metrics. Numeric labels appear at the end of each bar for precise data communication, while a central circular chart icon emphasizes the analytical theme. The 16:9 widescreen 2-slide set integrates seamlessly into business presentations, quarterly reports, and marketing strategy decks for market analysis and competitive positioning sections.
Usage Points
-
Main Usage
Compares quantitative data across multiple years or categories using horizontal bars. Ideal for displaying revenue trends, market share distribution, competitive performance benchmarks, departmental KPIs, and year-over-year growth metrics. The hologram gradient color scheme visually prioritizes data importance and engagement.
-
How to Use
Insert into business reports' market analysis sections, marketing strategy decks' competitive advantage slides, investor pitch decks' performance metrics, and proposal documents' benchmarking data. Simply edit bar lengths and numeric labels with your own data and drop into your presentation workflow.
-
Recommended For
Executives, marketing teams, sales leaders, and business strategists preparing data-driven decision materials. Particularly suited for annual performance reviews, market entry strategies, competitive intelligence presentations, ROI analysis, and quarterly business updates.
-
Slide Structure
2-slide set. Slide 1 features four horizontal bars (2029: 60/30, 2028: 55/25, 2027: 50/20, 2026: 45/35) with hologram cyan-blue-magenta-gray gradients, centered circular chart icon, and right-aligned text area. Slide 2 mirrors the layout on black background. All bars include numeric labels and year indicators.
Related Products
-

Double Horizontal Bar Graph for Market Analysis – Competitive Advantage and Future Outlook
#Market and Competitor Analysis #Graph #Future Outlook
-

Forward-looking Line Chart – Market Growth Prediction
#Market and Competitor Analysis #Graph #Future Outlook
-

Trend of Comparison Items in Line Chart – Emphasizing Market Outlook
#Market and Competitor Analysis #Graph #Future Outlook
-

Bar Chart of Bike Exercise – Market Trends and Future Outlook
#Market and Competitor Analysis #Graph #Future Outlook
