Camping Market Future Outlook Graph
RJ0600031_26
- Last Update 06/29/2025
- File Size 1.4MB
- # of Slides 2
- File Format PPTX
- Slide Ratio 16:9
- Color
Keywords
- #Content-Based Slides
- #Design-Based Slides
- #Market and Competitor Analysis
- #Graph
- #Future Outlook
- #Competitive Advantage
- #Line
- #Line Chart
- #16:9
- #line chart PowerPoint slide
- #dual-series trend analysis
- #45-year market forecast
- #data visualization slide template
- #how to create line chart in PowerPoint
About the Product
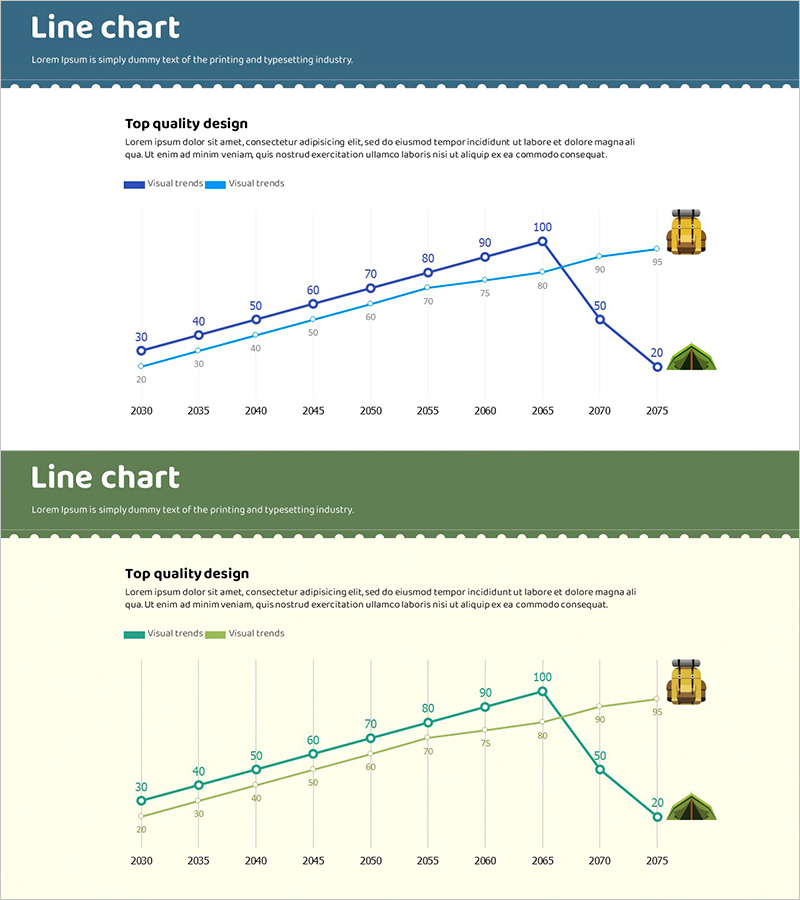
A PowerPoint slide featuring a dual-series line chart visualizing the camping market's long-term outlook from 2030 to 2075. Two trend lines in navy and light blue represent contrasting market trajectories, with data point labels and numerical values clearly marked. Camping vehicle and tent icons on the right symbolize market segments. This 16:9 two-slide deck is ready for market analysis, competitive positioning, and future outlook presentations in business plans, investment pitches, and strategic reports.
Usage Points
-
Main Usage
Visualize long-term market or industry trends using two or more data series to compare growth patterns, forecasts, and competitive scenarios. Effectively communicates upward, downward, and fluctuating trends over extended time periods.
-
How to Use
Replace the X-axis (years) and Y-axis (values) with your own data. Update series names and legend labels, modify data point numbers, and swap the right-side icons to match your industry or product category.
-
Recommended For
Market analysts, strategic planners, investment professionals, and consultants presenting market size, growth rates, and competitive trends. Ideal for business plans, investor pitch decks, market research reports, and executive strategy presentations.
-
Slide Structure
Two-slide layout. Slide 1: Navy header + dual-series line chart with 45 data points and numerical labels + camping icons on right. Slide 2: Green header + identical chart structure with background grid. 16:9 aspect ratio, PPTX format.
Related Products
-

Analysis of Reading Volume by Data – Market Status and Competitive Advantage
#Market and Competitor Analysis #Diagram #Graph
-

Trend of Comparison Items in Line Chart – Emphasizing Market Outlook
#Market and Competitor Analysis #Graph #Future Outlook
-

Sales Performance Comparison Slide – Market Analysis and Competitive Edge
#Market and Competitor Analysis #Graph #Future Outlook
-

Comparison Emphasis Line Graph & Explanatory Text – Market Analysis and Competitive Advantage
#Market and Competitor Analysis #Graph #Future Outlook
