Visualizing Financial Performance with Comparison Tables – Transparent Information Delivery
RJ0200012_23
- Last Update 03/31/2025
- File Size 1.3MB
- # of Slides 2
- File Format PPTX
- Slide Ratio 16:9
- Color
Keywords
About the Product
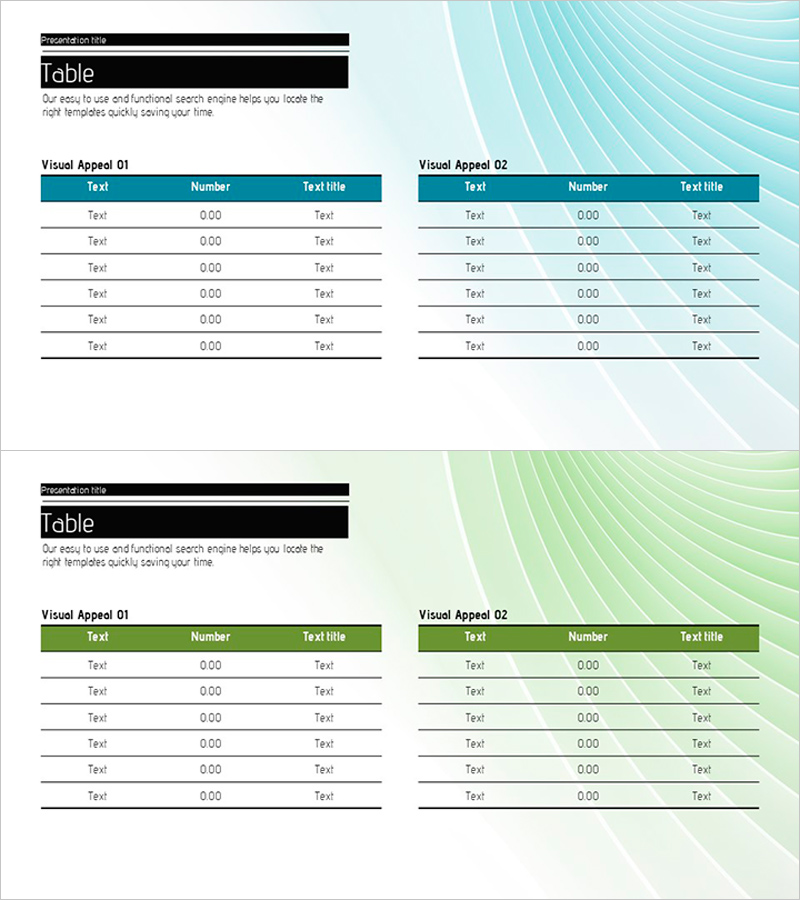
A professional table slide set designed to clearly compare and analyze financial performance and business metrics. Features teal and green header designs that strengthen data categorization, with each table structured in three columns: text, number, and title for easy information organization. This PowerPoint presentation slide is ready to use immediately for financial planning, balance sheet analysis, performance comparison, and various business presentations. Comprises 2 slides optimized for 16:9 widescreen format and PPTX compatibility.
Usage Points
-
Main Usage
Delivers numerical data such as financial performance, business indicators, and budget plans in a structured table format to audiences. The three-column layout (text, number, title) enables effective comparative analysis, while color differentiation strengthens information hierarchy and visual clarity.
-
How to Use
Apply to financial reports, business plans, investor presentations, and similar documents in sections covering performance comparison, budget versus actual results, and departmental metrics. Customize header colors and text to match your data, and reuse the 2 slides as needed for multiple data sets.
-
Recommended For
Recommended for finance professionals, CFOs, executives, business analysts, and consultants requiring quantitative data-driven presentations. Ideal for quarterly performance reviews, budget reviews, investor relations meetings, and internal management discussions.
-
Slide Structure
2-slide set. Each slide features a 3-column table with teal or green header, providing 6 rows of data entry areas (text, number, title columns). Color-differentiated headers visually separate the two tables, optimized for 16:9 widescreen format.
Related Products
-

Organize Financial Plans with Abstract Pattern Template
#Financial Plans and Performance #Diagram #Balance Sheet
-

Sleek Diagram and Chart Design
#Financial Plans and Performance #Diagram #Balance Sheet
-

Analysis Table of Korean Culture – An Effective Data Visualization Tool
#Financial Plans and Performance #Diagram #Balance Sheet
-

Modern Blue Table Chart Presentation Template
#Financial Plans and Performance #Diagram #Balance Sheet
