Fantastic Wide Diagram – Organizational Chart and Past Achievements
RJ0200049_4
- Last Update 04/12/2025
- File Size 1MB
- # of Slides 2
- File Format PPTX
- Slide Ratio 16:9
- Color
Keywords
- #Content-Based Slides
- #Design-Based Slides
- #Company Introduction
- #Diagram
- #Graph
- #Organizational Chart
- #Key Achievements
- #Structure
- #Column
- #Tree Diagram
- #Segmented Column
- #16:9
- #organizational chart PowerPoint slide
- #bar graph diagram PPT
- #company structure presentation
- #performance comparison chart
- #org chart template download
- #business report slide design
About the Product
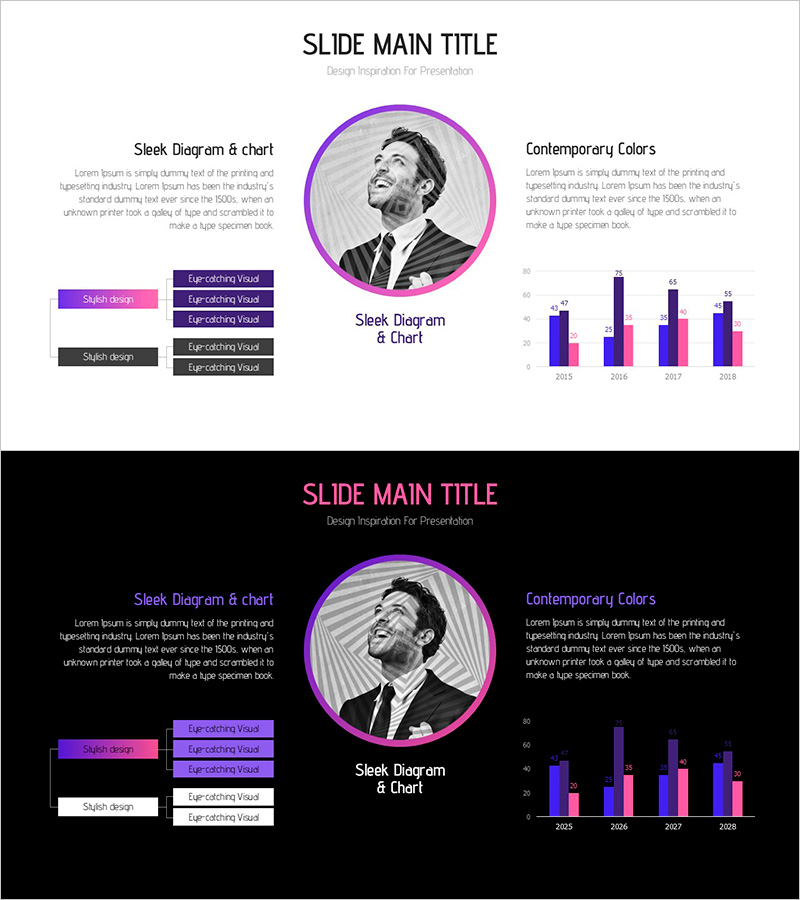
A 2-slide PowerPoint presentation combining organizational hierarchy and performance metrics in a single cohesive design. The first slide features a central circular image surrounded by a hierarchical organizational chart on the left and legend elements on the right. The second slide displays year-over-year performance data using grouped bar charts in purple and pink tones. This slide deck is ready to use for company introductions, business performance reports, organizational restructuring announcements, and investor presentations. Delivered in 16:9 widescreen PPTX format, fully editable in all PowerPoint versions.
Usage Points
-
Main Usage
Simultaneously visualize organizational structure and performance metrics to communicate company scale and business results. The organizational chart clarifies reporting relationships and departmental hierarchy, while the bar graphs enable quantitative comparison of revenue, profit, growth rates, and other key performance indicators across multiple periods.
-
How to Use
Deploy in company introduction sections, quarterly and annual performance reports, organizational restructuring announcements, and investor pitch decks. Directly edit text fields and numerical data to customize with your organization's structure and actual performance figures for immediate presentation use.
-
Recommended For
HR managers, executives, business development teams, and finance departments presenting organizational structure and business results to internal and external stakeholders. Particularly effective for employee onboarding, investor meetings, shareholder assemblies, and quarterly earnings presentations.
-
Slide Structure
Slide 1: Central circular image with 4-5 tier hierarchical org chart on left side and legend text boxes on right. Slide 2: Title header with dual-series bar charts below showing year-over-year data (2015-2018). Color scheme: purple (#7B68EE) and pink (#FF69B4) accents, black typography, 16:9 widescreen format.
Related Products
-

Tree Structure Diagram – Organizational Chart Visualization
#Company Introduction #Diagram #Organizational Chart
-

Simple Cement Theme Organization Chart Diagram – Perfect for Company Introduction
#Company Introduction #Diagram #Organizational Chart
-

Business Profile Organization Chart Diagram – Visualizing Efficient Team Structure
#Company Introduction #Diagram #Organizational Chart
-

Business Area Organization Chart Diagram – Systematic Structure
#Company Introduction #Diagram #Business Areas
