Donut Chart for Visualizing Business Revenue Model – Effective Presentation Template
RJ0200051_22
- Last Update 04/13/2025
- File Size 0.3MB
- # of Slides 2
- File Format PPTX
- Slide Ratio 16:9
- Color
Keywords
About the Product
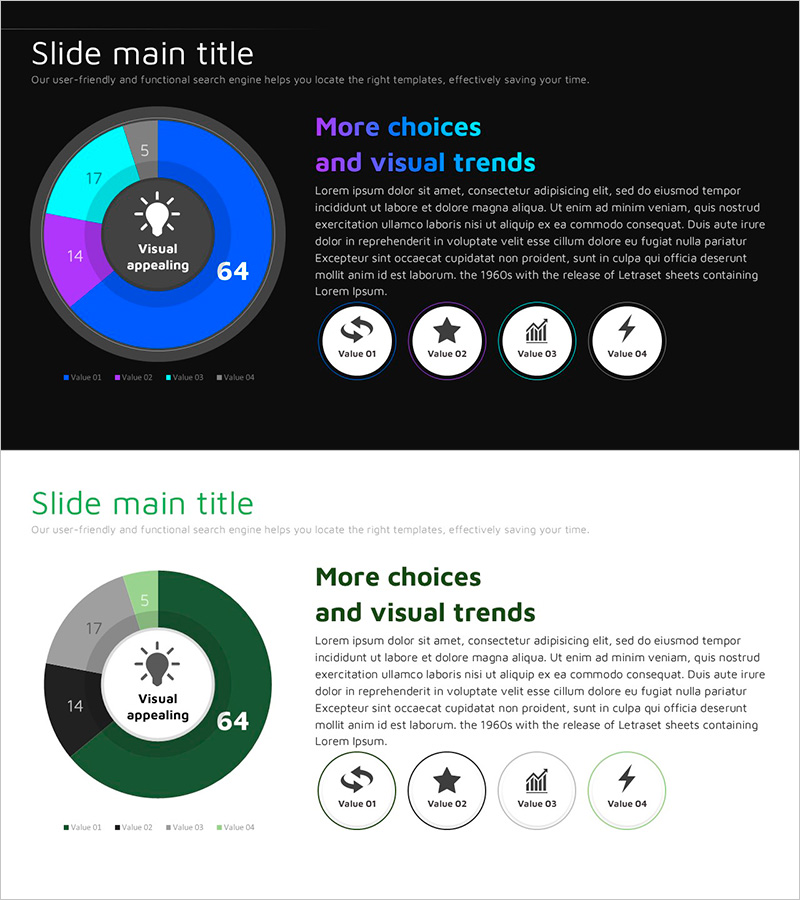
A professional donut chart PowerPoint slide designed to visualize business revenue structure and portfolio composition. The central figure '64' combined with four color-coded segments (Value 01–04) effectively communicates revenue distribution, income source breakdown, and business portfolio allocation. Two color versions are provided: dark background with blue, cyan, magenta, and gray tones, and light background with green, charcoal, and gray tones, allowing flexible adaptation to your presentation theme. The 2-slide template is ready to edit and deploy across company overviews, business plans, investor pitch decks, quarterly performance reports, and strategic presentations.
Usage Points
-
Main Usage
Clearly communicate business revenue composition, sales distribution, and portfolio breakdown using a central numeric value and four distinct segments. The prominent center figure emphasizes overall scale, while color-coded segments facilitate item-by-item comparison and stakeholder understanding.
-
How to Use
Insert into company overview presentations to explain business divisions, business plans to detail revenue structure, investor pitch decks to showcase portfolio composition, and quarterly reports to analyze sales distribution. Edit segment values and labels to customize for your specific data and messaging.
-
Recommended For
CFOs and finance managers presenting revenue structure to executives and investors; marketing teams analyzing business portfolio; business development teams presenting new venture allocation. Ideal for board meetings, shareholder assemblies, investor conferences, and data-driven strategic presentations.
-
Slide Structure
Central numeric value '64' anchors the design, with four color-differentiated segments representing proportional data. Legend positioned at the bottom clarifies segment meanings. Includes two complete slide layouts: dark background version (blue, cyan, magenta, gray) and light background version (green, charcoal, gray) for flexible theme integration.
Related Products
-

Modern Wide PowerPoint Template Donut Chart - Visualizing Revenue Model
#Product/Service Introduction #Business Introduction #Diagram
-

Corporate Profit Structure Analysis Donut Chart
#Product/Service Introduction #Business Introduction #Diagram
-

Colors Theme Presentation Template Donut Chart – Visualizing Company Performance
#Company Introduction #Business Introduction #Graph
-

Donut Chart for Business Strategy Visualization – Performance-Focused Marketing
#Business Introduction #Business Strategy #Marketing Plan and Strategy
