Colors Theme Presentation Template Donut Chart – Visualizing Company Performance
RJ0200043_6
- Last Update 04/10/2025
- File Size 1.3MB
- # of Slides 2
- File Format PPTX
- Slide Ratio 16:9
- Color
Keywords
About the Product
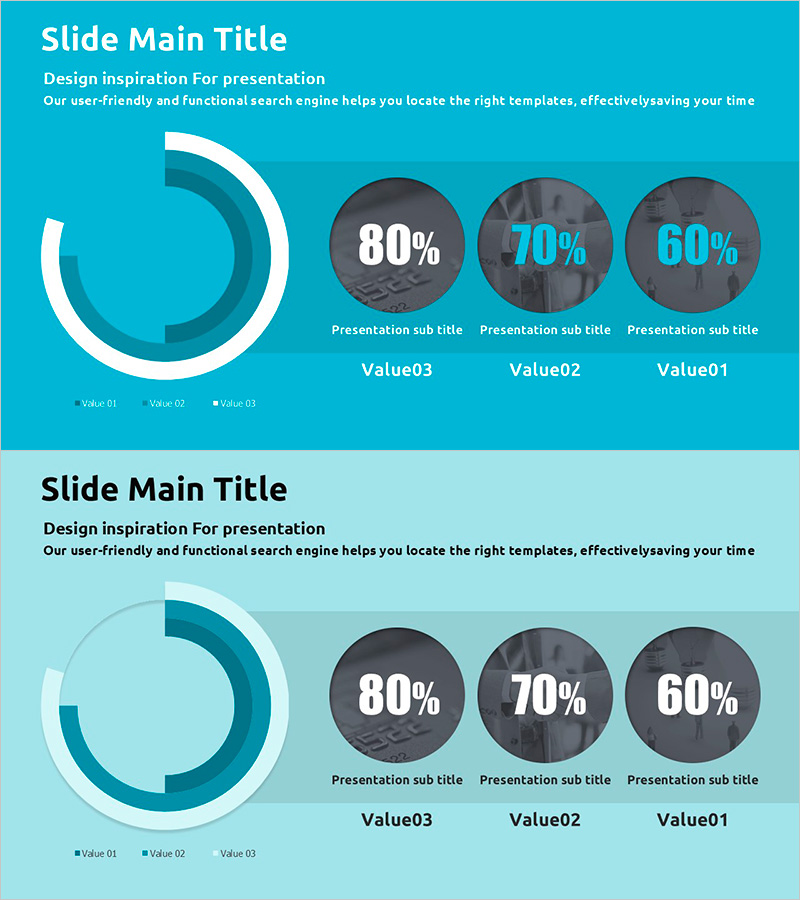
A professional PowerPoint slide featuring a 3-item donut chart design with teal gradient background for visualizing company performance, sales metrics, and business segment contributions. The layout combines a large donut diagram on the left with three circular pie charts on the right, each displaying percentage values (80%, 70%, 60%). Perfect for business presentations, quarterly reports, and investor meetings. The 2-slide set provides flexible data visualization options with editable text, numbers, and color schemes for immediate use in presentations.
Usage Points
-
Main Usage
Effectively communicate three-way data comparisons and percentage distributions using donut and pie chart formats. The teal gradient background conveys professionalism and trust, making it ideal for executive presentations, financial reports, and strategic business communications where data clarity is essential.
-
How to Use
Slide 1 presents an overview with a large donut diagram showing the overall composition, while Slide 2 provides detailed analysis through three separate pie charts. Simply double-click text and numbers to input your own data, and adjust colors to match your corporate branding or presentation theme.
-
Recommended For
Executive dashboards, quarterly business reviews, investor presentations, sales performance reports, market analysis briefings, and strategic planning sessions. Ideal for finance teams, marketing departments, business development, and C-suite communications requiring data-driven visual storytelling.
-
Slide Structure
Slide 1: Teal gradient background with large left-aligned donut diagram (3-layer segmentation) and three right-aligned pie charts (80%, 70%, 60% labeled) with legend. Slide 2: Light teal background with alternative layout. 16:9 widescreen format, fully editable PPTX file.
Related Products
-

Modern Wide PowerPoint Template Donut Chart - Visualizing Revenue Model
#Product/Service Introduction #Business Introduction #Diagram
-

Blue Line Wide Template Donut Chart – Performance Analysis
#Company Introduction #Market and Competitor Analysis #Graph
-

Trend Color Donut Chart Slide Template – Market and Competitive Analysis
#Company Introduction #Market and Competitor Analysis #Graph
-

Fantastic Donut Chart for Business Overview – Engaging Product Presentation
#Product/Service Introduction #Business Introduction #Graph
