Profit Structure Analysis Donut Chart
RM0500009_12
- Last Update 02/22/2025
- File Size 0.5MB
- # of Slides 2
- File Format PPTX
- Slide Ratio 16:9
- Color
Keywords
- #Content-Based Slides
- #Design-Based Slides
- #Product/Service Introduction
- #Business Introduction
- #Diagram
- #Graph
- #Development Status
- #Revenue Model
- #Table
- #Circles
- #Doughnut Chart
- #16:9
- #donut chart PowerPoint
- #pie chart slide template
- #profit structure analysis
- #revenue ratio visualization
- #financial data chart
- #donut graph template download
About the Product
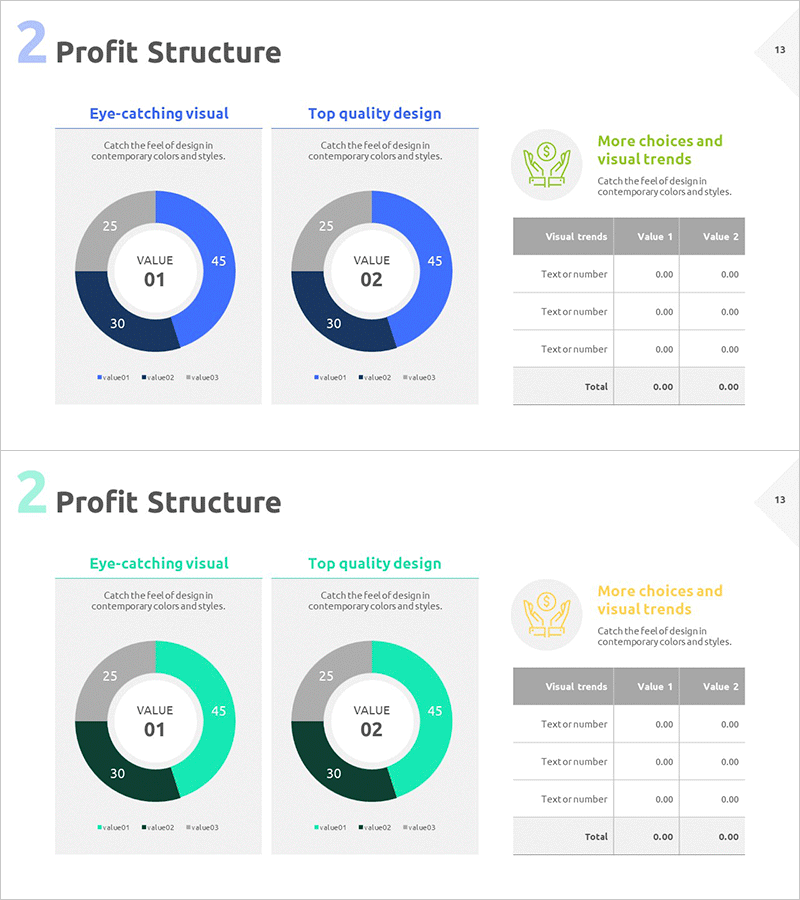
A professional donut chart PowerPoint slide for visualizing financial performance and revenue structure analysis. The concentric ring design displays three data series simultaneously, enabling clear comparison of each segment's proportion relative to the total. The harmonious blue, green, and gray color palette is ideal for financial reports and business presentations. This 2-slide set offers two distinct design styles: 'Eye-catching Visual' with bold blue gradients and 'Top Quality Design' with balanced color distribution. An integrated data table allows real-time numerical input and automatic chart updates for seamless presentation customization.
Usage Points
-
Main Usage
Clearly illustrate corporate profit structure, revenue distribution by source, and cost composition breakdown using a donut chart format. The concentric ring structure enables multi-layer data representation, effectively communicating the relationship between whole and parts—essential for financial analysis and business performance reporting.
-
How to Use
Apply this slide in business plans, investor pitch decks, quarterly financial reports, and executive dashboard presentations when explaining revenue structure and cost allocation. The integrated data table allows direct numerical input with automatic chart synchronization, enabling real-time data reflection without manual redesign.
-
Recommended For
Ideal for CFOs, financial analysts, executives, business consultants, and professionals requiring revenue analysis and financial status communication. Particularly effective for quarterly and annual results presentations, investor relations meetings, and internal management briefings.
-
Slide Structure
Two-slide set with each slide displaying three data series in concentric donut format. The 'Eye-catching Visual' version features blue gradient emphasis for visual impact, while the 'Top Quality Design' version uses balanced blue, green, and gray tones for professional credibility. An editable data table on the upper right enables direct numerical input with automatic chart updates.
Related Products
-

Development Status Donut Chart – Business Introduction
#Product/Service Introduction #Business Introduction #Diagram
-

Corporate Profit Structure Analysis Donut Chart
#Product/Service Introduction #Business Introduction #Diagram
-

Science Experiment Analysis Circle Graph Table Chart – Technological Advancement
#Product/Service Introduction #Technical Approach #Diagram
-

Investment Profit Structure Donut Chart
#Product/Service Introduction #Business Introduction #Diagram
