Development Status Donut Chart – Business Introduction
RM0500010_12
- Last Update 02/22/2025
- File Size 0.5MB
- # of Slides 2
- File Format PPTX
- Slide Ratio 16:9
- Color
Keywords
- #Content-Based Slides
- #Design-Based Slides
- #Product/Service Introduction
- #Business Introduction
- #Diagram
- #Graph
- #Development Status
- #Revenue Model
- #Table
- #Circles
- #Doughnut Chart
- #16:9
- #donut chart PowerPoint slide
- #pie chart presentation template
- #4-stage progress visualization
- #business status report slide
- #circular graph PPT download
About the Product
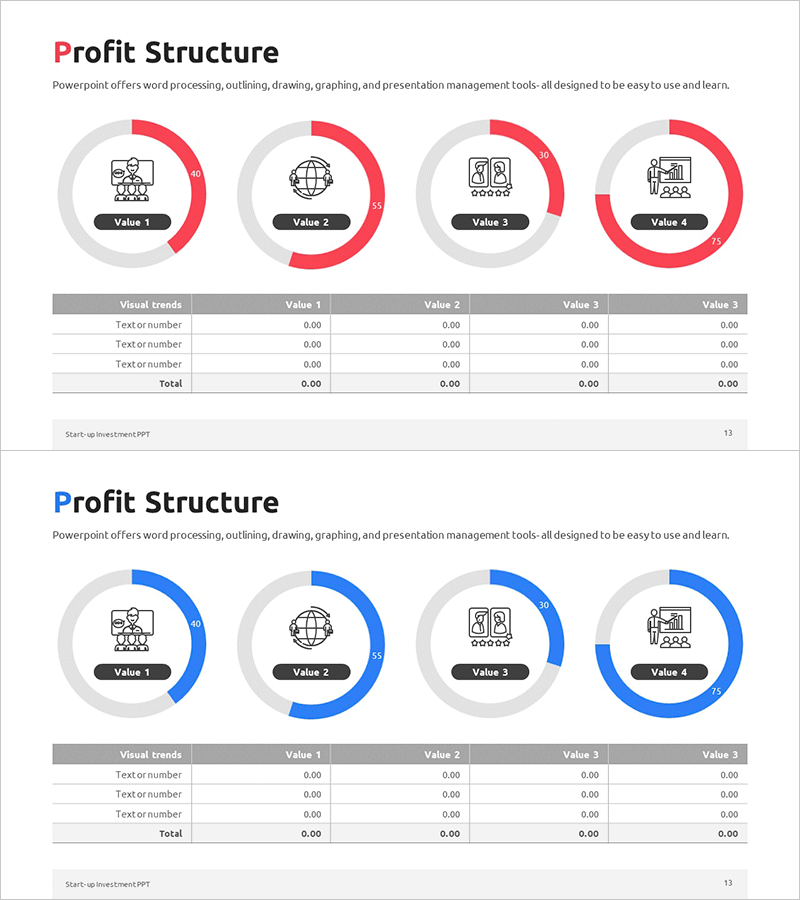
A PowerPoint slide featuring four donut charts in red and blue dual-tone colors to visualize business progress and project stages. Each circular graph displays progress percentages with distinct icons and labels for clear differentiation. Optimized for 16:9 widescreen format in a 2-slide set, ready for immediate use in business introductions, project status updates, and development progress presentations. Fully editable PPTX format allows you to customize data values and text labels effortlessly.
Usage Points
-
Main Usage
Visualize business progress, project phase completion rates, and development status using intuitive donut charts. Compare four metrics simultaneously to effectively communicate project milestones in business presentations, investor pitches, and executive reports.
-
How to Use
Open the slide and replace the chart values and labels with your own data. Maintain or customize the red and blue color scheme to match your brand. Click the center icons to swap with alternative images, edit the title and description text boxes, then present to your audience.
-
Recommended For
Business planners, project managers, development leads, investor relations professionals, and executive presenters. Ideal for startup pitch decks, business plans, quarterly progress reports, product development timelines, and marketing campaign status updates.
-
Slide Structure
2-slide set with four donut charts arranged horizontally on each slide. Each chart features a center icon (people, globe, document, chart) with corresponding labels. A Visual trends data table at the bottom consolidates numerical values, combining chart visualization with tabular data representation.
Related Products
-

Profit Structure Analysis Donut Chart
#Product/Service Introduction #Business Introduction #Diagram
-

Development Status Analysis Chart - Visualization for Effective Market Analysis
#Product/Service Introduction #Market and Competitor Analysis #Diagram
-

Fantastic Donut Chart for Business Overview – Engaging Product Presentation
#Product/Service Introduction #Business Introduction #Graph
-

Corporate Profit Structure Analysis Donut Chart
#Product/Service Introduction #Business Introduction #Diagram
