Infinite Energy Wide PPT Line Chart
RJ0200051_11
- Last Update 04/13/2025
- File Size 0.3MB
- # of Slides 2
- File Format PPTX
- Slide Ratio 16:9
- Color
Keywords
- #Content-Based Slides
- #Design-Based Slides
- #Market and Competitor Analysis
- #Financial Plans and Performance
- #Graph
- #Competitor Analysis
- #Sales and Revenue
- #Line
- #Line Chart
- #16:9
- #line chart PowerPoint
- #multi-series chart template
- #trend analysis slide
- #market analysis PPT
- #competitive analysis chart
- #financial performance graph
About the Product
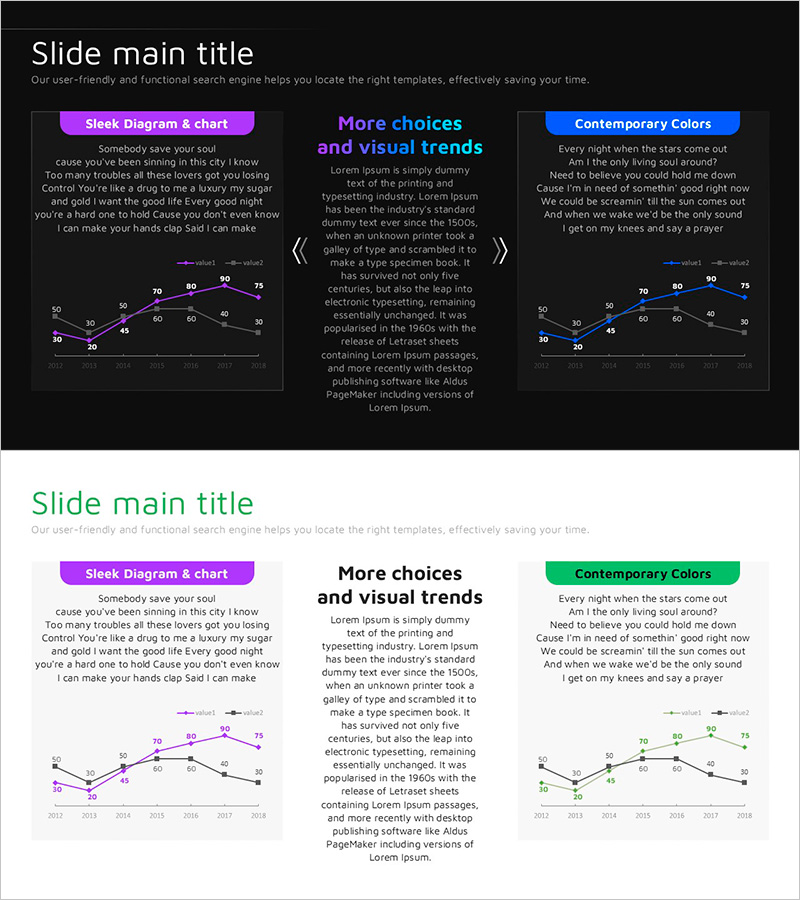
A multi-series line chart PowerPoint slide optimized for market analysis and competitive comparison. The dark background features three intersecting data series in purple, green, and blue, clearly visualizing numerical changes and trends over time. With a 16:9 widescreen format and 2-slide composition, this presentation template is ready to use for financial performance reports, sales analysis, competitive tracking, and other business presentations. Each data point is distinctly marked, allowing complex numerical information to be communicated intuitively. All background colors, text boxes, and chart elements are fully editable to match your specific data and branding requirements.
Usage Points
-
Main Usage
Compares and analyzes multiple indicators over time by displaying several data series simultaneously. Enables visualization of sales volume, market share, and competitor performance in a single chart, making correlations and trends immediately apparent to your audience.
-
How to Use
Insert this slide into the performance analysis section of financial reports, market analysis pages of business plans, or competitive analysis slides of investor pitches. Customize the series colors and legend to match your data, then update axis labels and numerical values to reflect your specific metrics.
-
Recommended For
Finance professionals, marketing strategists, executives, consultants, and data analysts preparing data-driven decision materials. Particularly suitable for quarterly or annual performance comparisons, competitive landscape analysis, and market share trend presentations.
-
Slide Structure
2-slide composition, each featuring a 4-series line chart. The X-axis represents years (2013–2018) and the Y-axis shows values (0–75). Four data series in purple, green, blue, and gray intersect across the chart. Data points are clearly marked, with separate legend and title areas for easy customization.
Related Products
-

Space Exploration Theme Broken Line Graph – Market and Competitor Analysis
#Market and Competitor Analysis #Graph #Competitor Analysis
-

Real Estate Upside Down Chart – Visualizing Market Trends
#Market and Competitor Analysis #Financial Plans and Performance #Graph
-

Competitor Analysis Broken Line Graph – Effective Visualization
#Market and Competitor Analysis #Graph #Competitor Analysis
-

Competitor Analysis Line Graph Table Chart – Presenting Market Trends
#Market and Competitor Analysis #Diagram #Graph
