Competitor Analysis Line Graph Table Chart – Presenting Market Trends
RJ0400031_19
- Last Update 05/26/2025
- File Size 7.9MB
- # of Slides 2
- File Format PPTX
- Slide Ratio 16:9
- Color
Keywords
About the Product
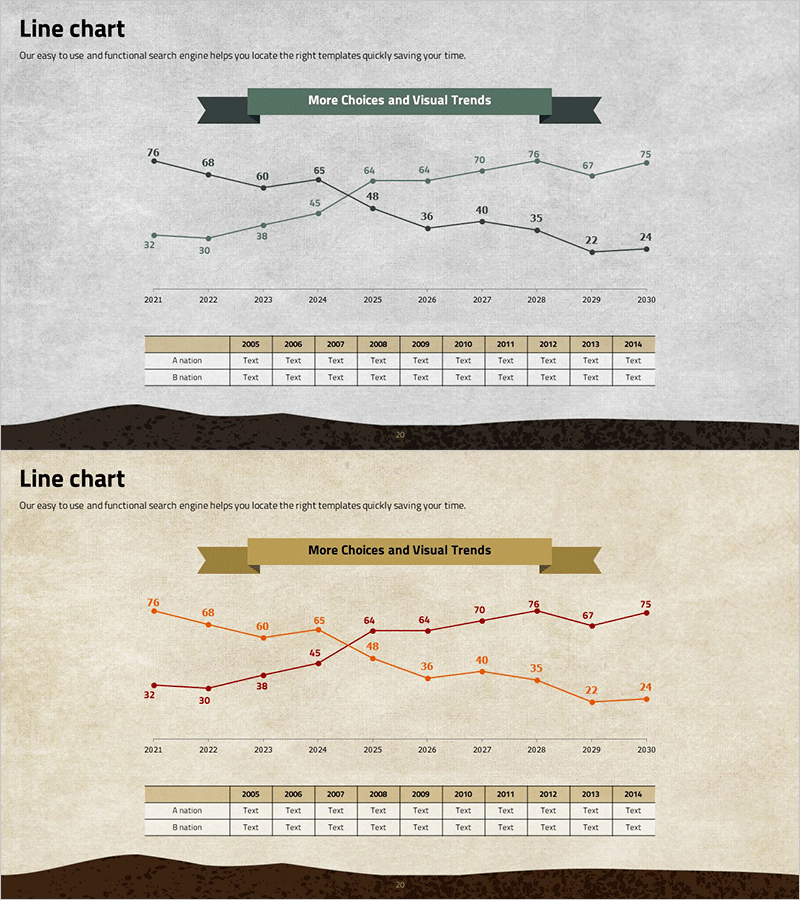
A professional PowerPoint slide featuring a dual-series line chart designed for competitor analysis and market trend visualization. The slide displays 10 years of data from 2021 to 2030, with two trend lines representing different data sets and numerical values clearly marked at each data point. A ribbon banner at the top emphasizes the title, while a data table at the bottom allows for detailed year-by-year information input. The textured gray background combined with dark green accent colors creates a professional presentation atmosphere, making this slide template immediately ready for business reports and presentations.
Usage Points
-
Main Usage
Optimized for comparing and analyzing changes in two or more data series over time, enabling stakeholders to identify trends and patterns at a glance. Ideal for presenting competitive performance comparisons, market share evolution, revenue trends, and other multi-series data analysis.
-
How to Use
Enter your analysis title in the ribbon banner at the top, then modify the line chart data points and values to match your actual statistical data. Complete the data table at the bottom with year-by-year figures to provide supporting evidence for your graphical analysis.
-
Recommended For
Executive reports, business analysis presentations, marketing strategy meetings, investor pitch decks, and consulting proposals where quantitative data-driven analysis is essential. Recommended for finance teams, marketing departments, and business planning units requiring data-backed decision-making materials.
-
Slide Structure
Structured with a ribbon banner title area at the top, a dual-series line chart in the center featuring 10 data points, 2 trend lines with numerical labels, and a 2-row × 10-column data table at the bottom. Optimized for 16:9 widescreen format and delivered as a 2-slide template.
Related Products
-

Sales and Profit Analysis Graph – Market Trends and Forecast
#Market and Competitor Analysis #Diagram #Graph
-

Dawn City Theme Competitor Analysis Graph – Understanding Market Trends
#Market and Competitor Analysis #Diagram #Graph
-

Graph Chart for Analysis Comparison – Market and Competitor Analysis
#Market and Competitor Analysis #Diagram #Graph
-

Target Market Analysis Line Graph – Visualizing Market Status
#Market and Competitor Analysis #Diagram #Graph
