Modern Wide PowerPoint Template Area Chart
RJ0200050_8
- Last Update 04/13/2025
- File Size 0.1MB
- # of Slides 2
- File Format PPTX
- Slide Ratio 16:9
- Color
Keywords
- #Content-Based Slides
- #Design-Based Slides
- #Business Strategy
- #Market and Competitor Analysis
- #Graph
- #Market Status
- #Other
- #Area Chart
- #Project Progress
- #16:9
- #area chart PowerPoint
- #area graph slide template
- #dual-series trend comparison
- #business performance analysis PPT
- #data visualization presentation
About the Product
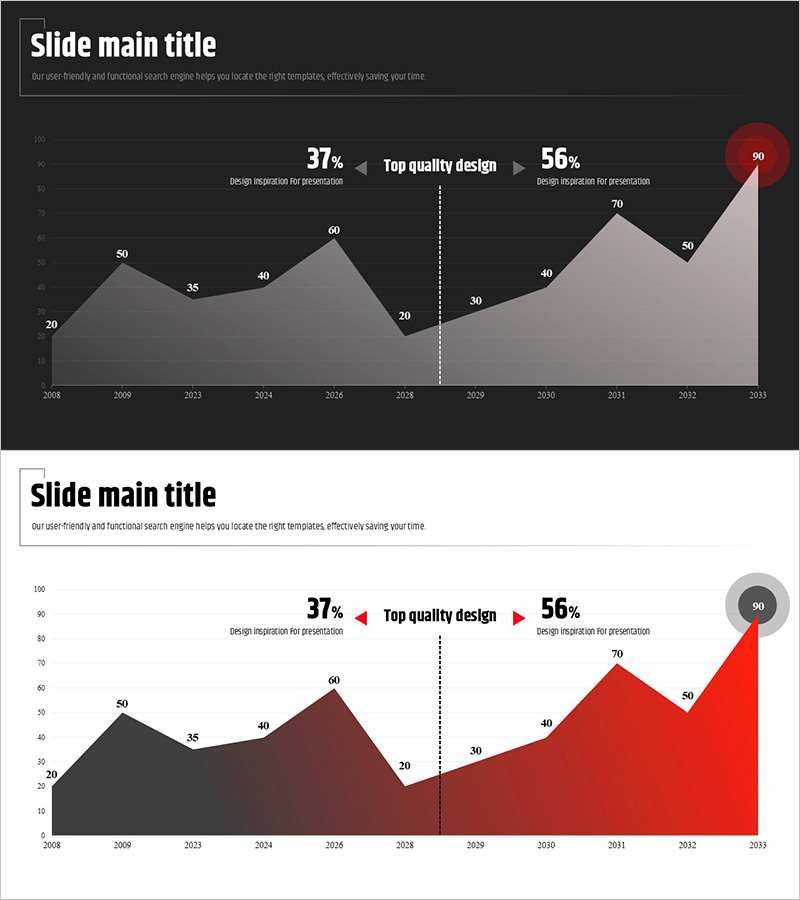
A dual-series area chart PowerPoint slide designed to visualize business progress and performance comparison over time. The dark background features gray and red gradient areas representing two data streams from 2008 to 2033, with a central vertical divider highlighting '37% Design Requirement' and '56% Presentation Design' segments. A circular accent badge (90) in the upper right emphasizes peak performance. This 16:9 widescreen 2-slide set is ready to use for business strategy presentations, competitive analysis, performance reporting, and strategic planning discussions.
Usage Points
-
Main Usage
Display temporal trends of two key metrics simultaneously, highlight inflection points in business performance, and communicate growth trajectories to stakeholders through overlapping area visualization.
-
How to Use
Replace the year axis and numerical values with your actual data. Modify the central divider text and circular badge number to emphasize your key performance milestone or turning point.
-
Recommended For
Executive dashboards, quarterly and annual performance reports, competitive benchmarking analysis, investor pitch decks, board meetings, strategic planning sessions, and data-driven decision-making presentations in B2B environments.
-
Slide Structure
Two overlapping area series (gray and red) on dark background spanning 2008–2033 (12 data points) with 0–100 vertical scale. Central vertical dashed line divides left (37%) and right (56%) segments. Circular badge (90) in upper right corner highlights maximum value.
Related Products
-

Market and Competitor Analysis Presentation Template – Intuitive Data Layout
#Market and Competitor Analysis #Graph #Market Status
-

Triangular Pattern Bar Chart Template – Market Insight Analysis
#Business Strategy #Market and Competitor Analysis #Graph
-

Orange Hexagon Presentation Template Area Chart
#Business Strategy #Market and Competitor Analysis #Graph
-

Horizontal Bar Segmentation Graph – Visualizing Business Strategy
#Business Strategy #Market and Competitor Analysis #Graph
