Application Chart Template – Market Analysis and Risk Management
RJ0200001_7
- Last Update 03/28/2025
- File Size 0.2MB
- # of Slides 2
- File Format PPTX
- Slide Ratio 16:9
- Color
Keywords
- #Content-Based Slides
- #Design-Based Slides
- #Market and Competitor Analysis
- #Risk Management and Regulatory Compliance
- #Graph
- #Market Status
- # Risk Management Strategy
- #Other
- #Area Chart
- #16:9
- #area chart PowerPoint
- #area graph slide template
- #trend analysis chart
- #data visualization PowerPoint
- #how to create area chart in PowerPoint
About the Product
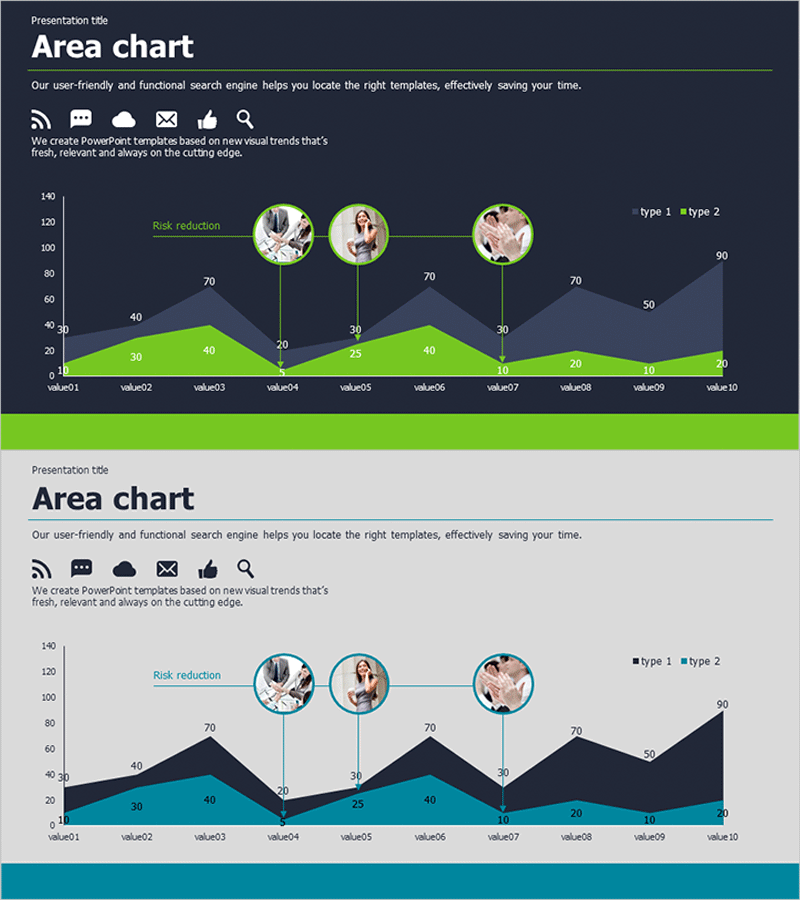
An area chart PowerPoint slide designed for market analysis and risk management presentations. The slide features a dark blue background with lime green and dark gray dual-series area graphs that clearly visualize data trends over time. Ten data points combined with three circular image milestones highlight key moments, while numerical labels and legends enhance information clarity. This 16:9 widescreen presentation template spans 2 slides and is ready to use in business reports, analytical documents, and strategic presentations.
Usage Points
-
Main Usage
Visualizes cumulative changes in multiple data series over time using an area chart format. Ideal for expressing business metrics such as market share evolution, revenue trends, and risk level changes, with circular image milestones emphasizing key events and turning points.
-
How to Use
Apply this slide in business reports, market analysis presentations, financial performance reviews, and risk management briefings to explain data trends. Edit the area colors and numerical values with your own data, and replace milestone images to highlight critical time periods relevant to your analysis.
-
Recommended For
Recommended for executives, finance teams, marketing professionals, consultants, and data analysts who require data-driven decision-making visuals. Particularly effective for quarterly and annual performance reviews, market trend reports, and risk assessment presentations.
-
Slide Structure
2-slide set. Slide 1: Dual-series area graph in lime green and dark gray, 10 X-axis data points (value01–value10), Y-axis range 0–140, three circular image milestones, legend (type 1, type 2), title and descriptive text. Slide 2: Identical structure with dark blue and turquoise color variation. 16:9 widescreen format.
Related Products
-

Market and Competitor Analysis Presentation Template – Intuitive Data Layout
#Market and Competitor Analysis #Graph #Market Status
-

Modern Wide PowerPoint Template Area Chart
#Business Strategy #Market and Competitor Analysis #Graph
-

Electric Vehicle Fire Accident Graph - Market Status and Risk Management
#Market and Competitor Analysis #Risk Management and Regulatory Compliance #Graph
-

The Importance of Sleep Time for Office Workers – Effective Risk Management
#Market and Competitor Analysis #Risk Management and Regulatory Compliance #Diagram
