Business Promotion Strategy Presentation Template – Effective Visualization and Structured Approach
RJ0500002_6
- Last Update 08/30/2025
- File Size 0.5MB
- # of Slides 2
- File Format PPTX
- Slide Ratio 16:9
- Color
Keywords
- #Content-Based Slides
- #Design-Based Slides
- #Business Strategy
- #Market and Competitor Analysis
- #Graph
- #Market Status
- #Column
- #Column Chart
- #Project Progress
- #16:9
- #grouped column chart PowerPoint
- #stacked bar chart template
- #year-over-year data comparison slide
- #business progress chart
- #multi-series graph template download
About the Product
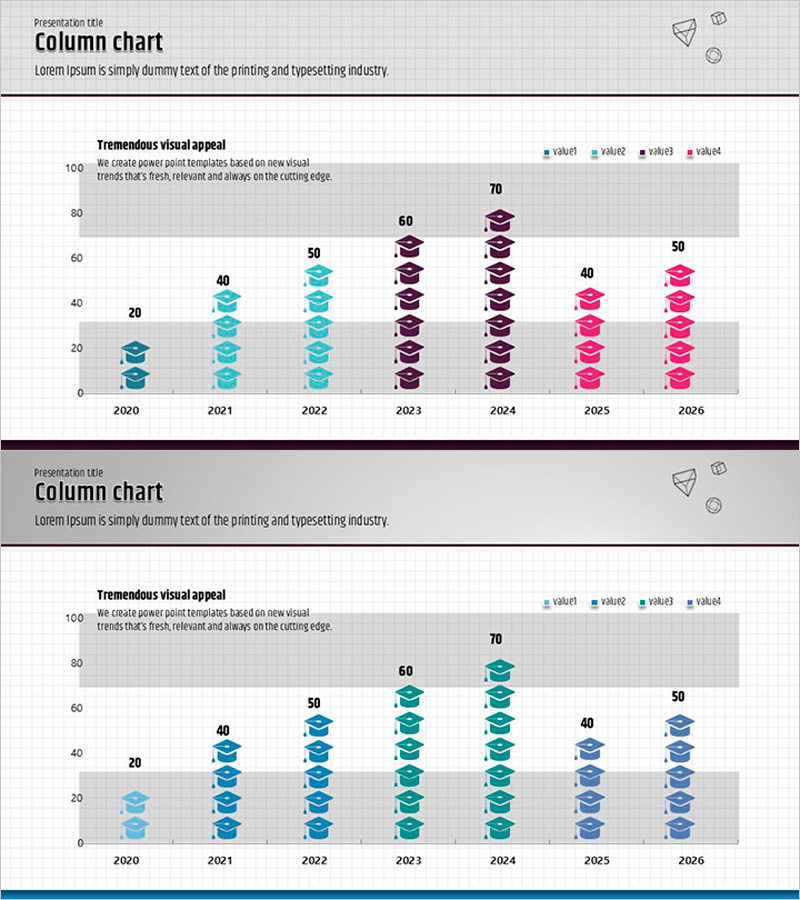
A grouped column chart PowerPoint slide designed to visualize business promotion progress and performance trends. This presentation template displays data across 4 series from 2020 to 2026, enabling clear year-over-year comparisons of business metrics, revenue growth, and goal achievement. The chart uses distinct color schemes—teal, purple, and pink—to differentiate data series, with gridlines and numerical labels ensuring accurate information delivery. The slide structure supports multiple data points simultaneously, making it ideal for business reports, quarterly reviews, and strategic planning presentations.
Usage Points
-
Main Usage
Visualizes multi-year business performance data by comparing 4 different metrics or departments simultaneously. Ideal for presenting revenue trends, customer acquisition rates, goal achievement percentages, and departmental performance metrics in executive presentations and business reviews.
-
How to Use
Replace the sample data values with your actual business metrics. Edit the column heights, numerical labels, and data series for each year to reflect your specific performance data. Colors can be customized to match your company branding or presentation theme.
-
Recommended For
Executive presentations, board meetings, quarterly and annual business reviews, investor pitch decks, departmental performance comparisons, strategic planning sessions, and business progress reports requiring multi-year trend analysis.
-
Slide Structure
2-slide set featuring grouped column charts with 7 years of data (2020–2026) displayed across 4 series. First slide uses teal and blue color gradients; second slide uses purple and pink tones. Each year displays maximum values with numerical labels for precise data communication.
Related Products
-

Infographic Design Wide Template Chart2 for Market Analysis
#Market and Competitor Analysis #Graph #Market Status
-

Simple & Modern Wide PowerPoint Vertical Bar Chart
#Market and Competitor Analysis #Financial Plans and Performance #Graph
-

Bar Graph Analysis for Business Strategy – Market Diagnosis
#Business Strategy #Market and Competitor Analysis #Graph
-

Weather Bar Graph - Market Status Analysis
#Market and Competitor Analysis #Graph #Market Status
