Modern Wide PowerPoint Template Bar chart&Table
RJ0200050_5
- Last Update 04/13/2025
- File Size 0.1MB
- # of Slides 2
- File Format PPTX
- Slide Ratio 16:9
- Color
Keywords
- #Content-Based Slides
- #Design-Based Slides
- #Business Introduction
- #Financial Plans and Performance
- #Diagram
- #Graph
- #Revenue Model
- #Sales and Revenue
- #Table
- #Column
- #Standard Table
- #Column Chart
- #16:9
- #horizontal bar chart PowerPoint
- #bar graph presentation slide
- #data table template
- #comparison chart slide
- #financial report PowerPoint
- #business analysis presentation
- #how to create bar chart in PowerPoint
About the Product
A 2-slide PowerPoint presentation optimized for business reports and financial analysis. The first slide features a horizontal bar chart comparing five data items with clear visual hierarchy, while the second slide provides a detailed data table for supplementary information. The design uses a dark gray background with white typography and red accent color to enhance credibility and visual impact. Formatted in 16:9 widescreen ratio for modern displays and delivered as fully editable PPTX files.
Usage Points
-
Main Usage
Clearly present and compare quantitative data using a horizontal bar chart, supplemented by a detailed data table for comprehensive information delivery. Ideal for financial performance reports, sales metrics, KPI analysis, market research findings, and any business presentation requiring numerical data visualization.
-
How to Use
Replace the bar values and labels with your own data on the first slide, then populate the table cells on the second slide with detailed information. Colors and fonts can be customized to match your corporate branding. Additional items can be added by duplicating bars and table rows as needed.
-
Recommended For
Finance teams presenting quarterly or annual results, marketing teams analyzing campaign performance, sales teams reporting regional or product-based metrics, executive strategy meetings, investor presentations, and board-level business briefings.
-
Slide Structure
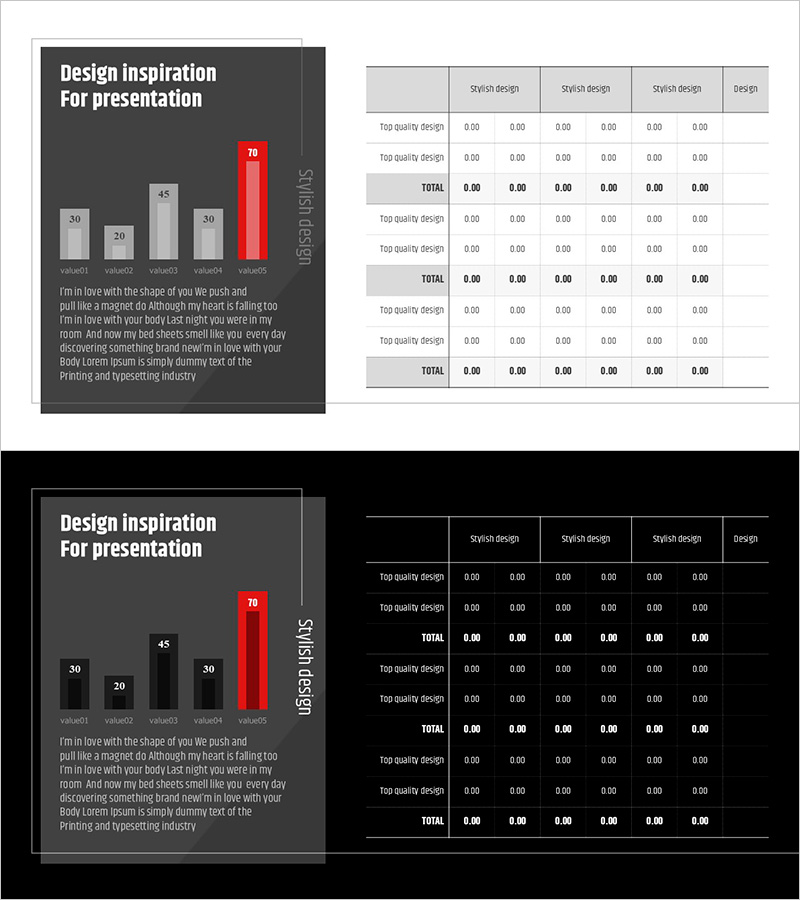
Slide 1: Horizontal bar chart with 5 data items (value01–value05, max 70) plus legend, title, and descriptive text. Slide 2: Data table with 6 columns (5 style design categories + Design label) and 7 rows (header + 6 data rows) for organized information display.
Related Products
-

Color-highlighted Bar Graphs and Tables – Optimized for Financial Analysis
#Financial Plans and Performance #Diagram #Graph
-

Visualizing Business Strategies with Tables & Charts – Clear Data Presentation
#Business Strategy #Financial Plans and Performance #Diagram
-

Typographic Wide Template Bar Chart & Table – Competitive Analysis and Performance
#Market and Competitor Analysis #Financial Plans and Performance #Diagram
-

Market Analysis Graphs & Tables – Visualizing Sales Growth
#Market and Competitor Analysis #Financial Plans and Performance #Diagram
