Color-highlighted Bar Graphs and Tables – Optimized for Financial Analysis
RJ0200012_6
- Last Update 04/01/2025
- File Size 1.3MB
- # of Slides 2
- File Format PPTX
- Slide Ratio 16:9
- Color
Keywords
- #Content-Based Slides
- #Design-Based Slides
- #Financial Plans and Performance
- #Diagram
- #Graph
- #Projected Return on Investment (ROI)
- #Sales and Revenue
- #Table
- #Column
- #Standard Table
- #Horizontal Table
- #Column Chart
- #16:9
- #column chart PowerPoint slide
- #financial analysis presentation template
- #data comparison graph
- #revenue chart template
- #PowerPoint bar graph slide
About the Product
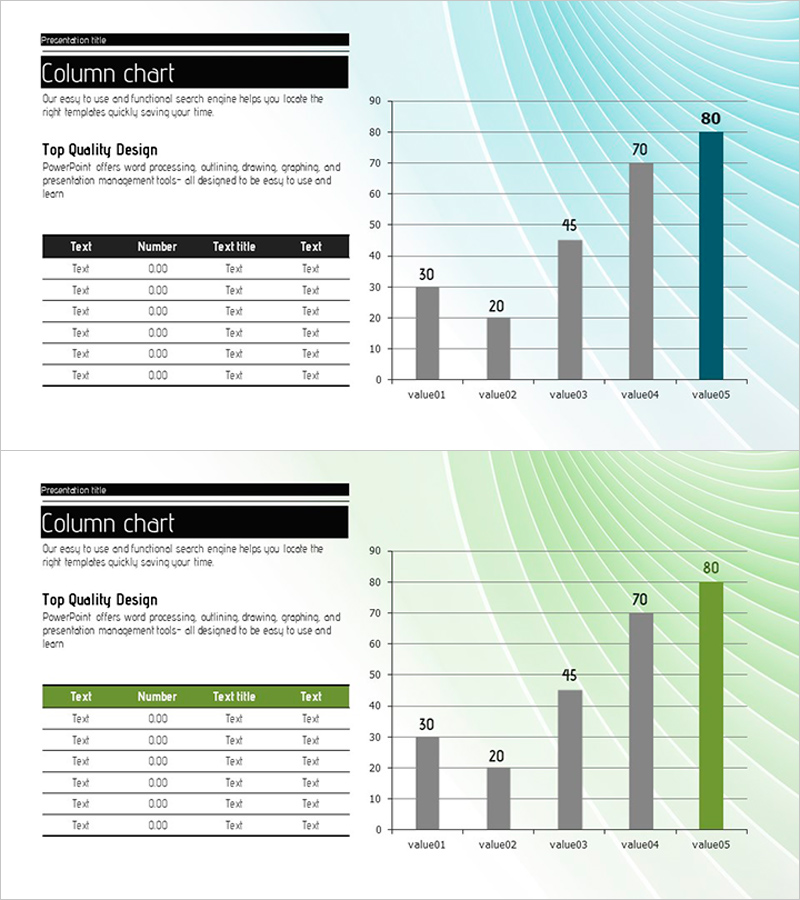
A PowerPoint slide optimized for financial analysis and revenue reporting. This presentation template features a vertical column chart comparing five data points alongside a detailed data table on a single slide. Three color gradients—light blue, gray, and dark teal—emphasize each value level, while the wavy background pattern adds visual depth. Provided in fully editable PPTX format, this slide is ready for quarterly earnings presentations, budget analysis reports, and financial performance reviews.
Usage Points
-
Main Usage
Presents financial metrics, revenue trends, and budget allocation data through side-by-side column chart and table visualization. The varying bar heights intuitively convey ranking and scale, while the table below provides precise numerical values for stakeholder review.
-
How to Use
Ideal for quarterly earnings calls, annual financial reports, investor presentations, and executive briefings. Simply replace the bar colors and numerical values with your own data to create a professional financial analysis slide in minutes.
-
Recommended For
CFOs, financial analysts, business development managers, IR professionals, and executives presenting performance metrics, budget forecasts, and financial comparisons. Best suited for data-driven decision-making presentations to senior leadership and investors.
-
Slide Structure
Title area at top left, five-item vertical column chart on the right (values 30, 20, 45, 70, 80 with final bar highlighted in dark teal), and a 6-row by 4-column data table at bottom left. Optimized for 16:9 widescreen format as a 2-slide set with editable elements.
Related Products
-

Modern Wide PowerPoint Template Bar chart&Table
#Business Introduction #Financial Plans and Performance #Diagram
-

Visualizing Business Strategies with Tables & Charts – Clear Data Presentation
#Business Strategy #Financial Plans and Performance #Diagram
-

Simple Circle Presentation Template Doughnut Chart – Visualizing Financial Performance
#Financial Plans and Performance #Diagram #Graph
-

Summer Vacation Template Table – Visualizing Financial Performance
#Financial Plans and Performance #Diagram #Projected Return on Investment (ROI)
