Bar Graph Visualization of Pet Data
RJ0800040_6
- Last Update 08/11/2025
- File Size 0.3MB
- # of Slides 2
- File Format PPTX
- Slide Ratio 16:9
- Color
Keywords
- #Content-Based Slides
- #Design-Based Slides
- #Market and Competitor Analysis
- #Financial Plans and Performance
- #Graph
- #Market Status
- #Sales and Revenue
- #Horizontal Bar
- #Segmented Horizontal Bar
- #16:9
- #horizontal bar chart PowerPoint
- #bar graph slide template
- #data visualization presentation
- #pet market analysis PPT
- #how to create bar chart in PowerPoint
About the Product
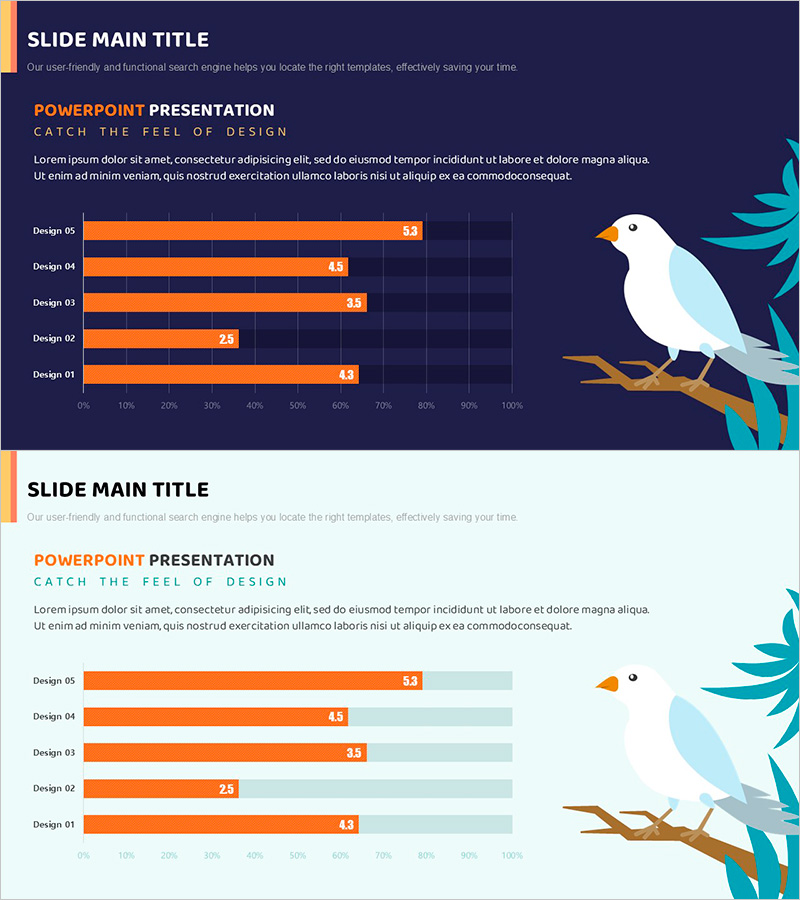
A PowerPoint slide featuring a horizontal bar chart that visualizes pet market data across five items with clear numerical comparison. The design uses orange bars with supporting grid lines on a dark navy background, complemented by turquoise bird illustrations for visual appeal. Two slide layouts are included—one with a dark background and one with a light background—allowing you to match your presentation's tone. Each bar displays numerical labels for precise data communication, making it ideal for market analysis, financial planning, business reports, and industry presentations. Fully editable and ready to use immediately.
Usage Points
-
Main Usage
Visualize and compare five key metrics of pet market data—such as market size, growth rate, consumer spending, or category breakdown—using horizontal bars. The bar length immediately conveys relative magnitude, while numerical labels provide exact values for precise data communication.
-
How to Use
Use this slide in market analysis presentations, business reports, or financial planning discussions to explain pet industry trends and data. The dark version suits professional conferences and investor pitches, while the light version works well for internal meetings and educational materials. Simply edit the bar lengths and labels to match your own data.
-
Recommended For
Pet industry analysts, marketing managers, business strategists, financial analysts, and market researchers presenting data-driven insights. Ideal for pet industry startups pitching to investors, corporate business reports, and competitive market analysis presentations.
-
Slide Structure
Five items (Design 01–05) represented as horizontal bars filled with orange gradient, each labeled with numerical values on the right. A background grid (0–100% scale) aids in visual comparison. A turquoise bird illustration in the upper right provides a visual accent and thematic connection to the pet market topic.
Related Products
-

Analysis of Fish and Fruit Intake – Market Status and Performance
#Market and Competitor Analysis #Financial Plans and Performance #Graph
-

Market Analysis Template with Bilateral Bar Graph Visualization
#Market and Competitor Analysis #Financial Plans and Performance #Graph
-

Simple Circle Template – Horizontal Segmentation Graph
#Market and Competitor Analysis #Graph #Market Status
-

Horizontal Bar Segmentation Graph – Visualizing Business Strategy
#Business Strategy #Market and Competitor Analysis #Graph
